Experian 2007 Annual Report Download - page 105
Download and view the complete annual report
Please find page 105 of the 2007 Experian annual report below. You can navigate through the pages in the report by either clicking on the pages listed below, or by using the keyword search tool below to find specific information within the annual report.-
 1
1 -
2
-
3
-
4
-
5
-
6
-
7
-
8
-
9
-
10
-
11
-
12
-
13
-
14
-
15
-
16
-
17
-
18
-
19
-
20
-
21
-
22
-
23
-
24
-
25
-
26
-
27
-
28
-
29
-
30
-
31
-
32
-
33
-
34
-
35
-
36
-
37
-
38
-
39
-
40
-
41
-
42
-
43
-
44
-
45
-
46
-
47
-
48
-
49
-
50
-
51
-
52
-
53
-
54
-
55
-
56
-
57
-
58
-
59
-
60
-
61
-
62
-
63
-
64
-
65
-
66
-
67
-
68
-
69
-
70
-
71
-
72
-
73
-
74
-
75
-
76
-
77
-
78
-
79
-
80
-
81
-
82
-
83
-
84
-
85
-
86
-
87
-
88
-
89
-
90
-
91
-
92
-
93
-
94
-
 95
95 -
 96
96 -
 97
97 -
 98
98 -
 99
99 -
 100
100 -
 101
101 -
 102
102 -
 103
103 -
 104
104 -
 105
105 -
 106
106 -
 107
107 -
 108
108 -
 109
109 -
 110
110 -
 111
111 -
 112
112 -
 113
113 -
 114
114 -
 115
115 -
116
-
117
-
118
-
119
-
120
-
121
-
122
-
123
-
124
-
125
-
126
-
127
-
128
-
129
-
130
-
131
-
132
-
133
-
134
-
135
-
136
-
137
-
138
 |
 |

Experian Annual Report2007 |103
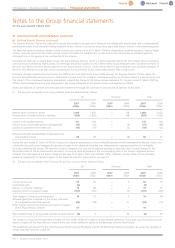
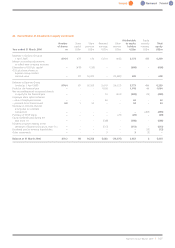
26 Financial instruments (continued)
(c) Additional information on financial liabilities (continued)
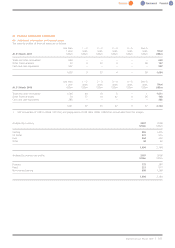
(ii) Analysis of financial liabilities by currency:
Sterling US Dollar Euro Other Total
At 31 March 2007 US$m US$m US$m US$m US$m
Loans and Borrowings
€548m 4.125% Euronotes 2007 – – 751 – 751
£350m 6.375% Eurobonds 2009 721 – – – 721
£334m 5.625% Euronotes 2013 627 – – – 627
Overdrafts 4 – 269 – 273
Effect of forward foreign exchange contracts and cross currency swaps2(1,065) 1,513 (516) 68 –
Other financial liabilities 40–––40
Trade and other payables1207 409 120 30 766
534 1,922 624 98 3,178
Sterling US Dollar Euro Other Total
At 31 March 2006 US$m US$m US$m US$m US$m
Loans and Borrowings
€568m 4.125% Euronotes 2007 – – 688 – 688
£350m 6.375% Eurobonds 2009 620 – – – 620
£350m 5.625% Euronotes 2013 595 – – – 595
Perpetual Securities 386 –––386
Bank loans 696 662 – – 1,358
Overdrafts – – 245 – 245
Effect of cross currency swaps2(947) 755 122 70 –
Other financial liabilities 51 – ––51
Trade and other payables11,552 454 108 20 2,134
2,953 1,871 1,163 90 6,077
1. VAT and other tax payable of US$42m (2006: US$125m), social security costs of US$75m (2006: US$75m) and accruals of US$200m
(2006: US$231m) are excluded from this analysis.
2. These represent the gross notional values of cross currency swaps and foreign exchange contracts if applicable.
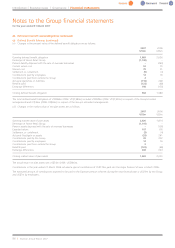
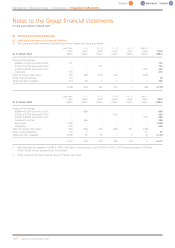
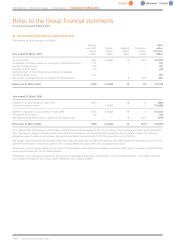
(iii) Analysis of financial liabilities by interest rate profile:
Non-interest
Floating Fixed bearing Total
At 31 March 2007 US$m US$m US$m US$m
Loans and borrowings 1,024 1,348 – 2,372
Effect of interest rate swaps1130 (130) – –
Other 40 – 766 806
1,194 1,218 766 3,178
Non-interest
Floating Fixed bearing Total
At 31 March 2006 US$m US$m US$m US$m
Loans and borrowings 1,603 2,289 – 3,892
Effect of interest rate swaps1825 (825) – –
Other 13 122 2,050 2,185
2,441 1,586 2,050 6,077
1. These represent the gross notional value of interest rate swaps.