Experian 2007 Annual Report Download - page 53
Download and view the complete annual report
Please find page 53 of the 2007 Experian annual report below. You can navigate through the pages in the report by either clicking on the pages listed below, or by using the keyword search tool below to find specific information within the annual report.
Experian Annual Report 2007 |51
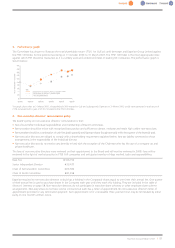
3. Performance graph
The Committee has chosen to illustrate the total shareholder return (‘TSR’) for GUS plc until demerger and Experian Group Limited against
the FTSE 100 Index for the period since listing on 11 October 2006 to 31 March 2007. The FTSE 100 Index is the most appropriate index
against which TSR should be measured, as it is a widely used and understood index of leading UK companies. The performance graph is
shown below:
The graph shows that, at 31 March 2007, a hypothetical £100 invested in GUS and subsequently, Experian on 31 March 2002 would have generated a total return of
£174 compared with a gain of £143 if invested in the FTSE 100 Index.
4. Non-executive directors’ remuneration policy
The Board’spolicy on non-executive directors’ remuneration is that:
•Fees should reflect individual responsibilities and membership of Board Committees.
•Remuneration should be in line with recognised best practice and sufficient to attract, motivate and retain high calibre non-executives.
•Remuneration should be a combination of cash fees (paid quarterly) and Experian shares (bought annually in the first quarter of the financial year).
•Non-executive directors are obliged to comply with a shareholding requirement explained below. Any tax liability connected to these
arrangements is the responsibility of the individual director.
•Non-executive directors do not receive any benefits in kind with the exception of the Chairman who has the use of a company car and
private healthcare.
The fees of non-executive directors were reviewed on their appointment to the Board and will next be reviewed in 2008. Fees will be
reviewed in the light of market practice in FTSE 100 companies and anticipated number of days worked, tasks and responsibilities.
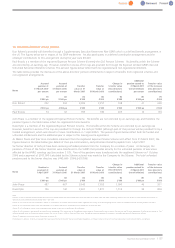
Base Fee €106,154
Senior Independent Director €19,437
Chair of Remuneration Committee €23,922
Chair of Audit Committee €31,398
Experian requires its non-executive directors to build up a holding in the Company’s shares equal to one times their annual fee. One quarter
of their annual fee is used to purchase shares in the Company each year until they reach this holding. They are included in the table of
directors’ interests on page 58. Non-executive directors do not participate in executive share schemes or other employee share scheme
arrangements. Non-executives do not have service contracts but each has a letter of appointment. No non-executive director’s letter of
appointment provides for any termination payment. Each appointment is for a renewable three year term but may be terminated by either
party on one month’swritten notice.


