Experian 2007 Annual Report Download - page 79
Download and view the complete annual report
Please find page 79 of the 2007 Experian annual report below. You can navigate through the pages in the report by either clicking on the pages listed below, or by using the keyword search tool below to find specific information within the annual report.-
 1
1 -
2
-
3
-
4
-
5
-
6
-
7
-
8
-
9
-
10
-
11
-
12
-
13
-
14
-
15
-
16
-
17
-
18
-
19
-
20
-
21
-
22
-
23
-
24
-
25
-
26
-
27
-
28
-
29
-
30
-
31
-
32
-
33
-
34
-
35
-
36
-
37
-
38
-
39
-
40
-
41
-
42
-
43
-
44
-
45
-
46
-
47
-
48
-
49
-
50
-
51
-
52
-
53
-
54
-
55
-
56
-
57
-
58
-
59
-
60
-
61
-
62
-
63
-
64
-
65
-
66
-
67
-
68
-
 69
69 -
 70
70 -
 71
71 -
 72
72 -
 73
73 -
 74
74 -
 75
75 -
 76
76 -
 77
77 -
 78
78 -
 79
79 -
 80
80 -
 81
81 -
 82
82 -
 83
83 -
 84
84 -
 85
85 -
 86
86 -
 87
87 -
 88
88 -
 89
89 -
90
-
91
-
92
-
93
-
94
-
95
-
96
-
97
-
98
-
99
-
100
-
101
-
102
-
103
-
104
-
105
-
106
-
107
-
108
-
109
-
110
-
111
-
112
-
113
-
114
-
115
-
116
-
117
-
118
-
119
-
120
-
121
-
122
-
123
-
124
-
125
-
126
-
127
-
128
-
129
-
130
-
131
-
132
-
133
-
134
-
135
-
136
-
137
-
138
 |
 |

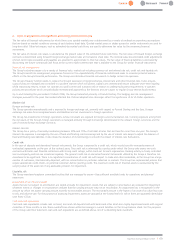
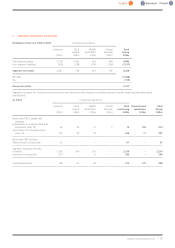
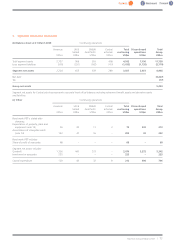
3. Segmental information (continued)
(b) Balance sheet at 31 March 2006 Continuing operations
Americas UK & EMEA/ Central Total Discontinued Total
Ireland Asia Pacific activities continuing operations Group
US$m US$m US$m US$m US$m US$m US$m
Total segment assets 2,727 906 501 408 4,542 7,196 11,738
Less: segment liabilities (503) (251) (162) (119) (1,035) (1,735) (2,770)
Segment net assets 2,224 655 339 289 3,507 5,461 8,968
Net debt (3,437)
Tax (77)
Group net assets 5,454
Segment net assets for Central activities represents corporate head office balances including retirement benefit assets and derivative assets
and liabilities.
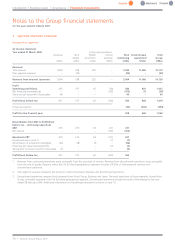
(c) Other Continuing operations
Americas UK & EMEA/ Central Total Discontinued Total
Ireland Asia Pacific activities continuing operations Group
US$m US$m US$m US$m US$m US$m US$m
Benchmark PBT is stated after
charging:
Depreciation of property, plant and
equipment (note 15) 36 20 11 3 70 243 313
Amortisation of intangible assets
(note 14) 143 41 16 – 200 32 232
Benchmark PBT includes:
Share of profit of associates 68 – – – 68 – 68
Segment net assets includes:
Goodwill 1,356 441 273 – 2,070 3,272 5,342
Investment in associates 225 – – – 225 – 225
Capital expenditure 129 43 32 8 212 494 706
Experian Annual Report2007 |77