Experian 2007 Annual Report Download - page 85
Download and view the complete annual report
Please find page 85 of the 2007 Experian annual report below. You can navigate through the pages in the report by either clicking on the pages listed below, or by using the keyword search tool below to find specific information within the annual report.-
 1
1 -
2
-
3
-
4
-
5
-
6
-
7
-
8
-
9
-
10
-
11
-
12
-
13
-
14
-
15
-
16
-
17
-
18
-
19
-
20
-
21
-
22
-
23
-
24
-
25
-
26
-
27
-
28
-
29
-
30
-
31
-
32
-
33
-
34
-
35
-
36
-
37
-
38
-
39
-
40
-
41
-
42
-
43
-
44
-
45
-
46
-
47
-
48
-
49
-
50
-
51
-
52
-
53
-
54
-
55
-
56
-
57
-
58
-
59
-
60
-
61
-
62
-
63
-
64
-
65
-
66
-
67
-
68
-
69
-
70
-
71
-
72
-
73
-
74
-
 75
75 -
 76
76 -
 77
77 -
 78
78 -
 79
79 -
 80
80 -
 81
81 -
 82
82 -
 83
83 -
 84
84 -
 85
85 -
 86
86 -
 87
87 -
 88
88 -
 89
89 -
 90
90 -
 91
91 -
 92
92 -
 93
93 -
 94
94 -
 95
95 -
96
-
97
-
98
-
99
-
100
-
101
-
102
-
103
-
104
-
105
-
106
-
107
-
108
-
109
-
110
-
111
-
112
-
113
-
114
-
115
-
116
-
117
-
118
-
119
-
120
-
121
-
122
-
123
-
124
-
125
-
126
-
127
-
128
-
129
-
130
-
131
-
132
-
133
-
134
-
135
-
136
-
137
-
138
 |
 |

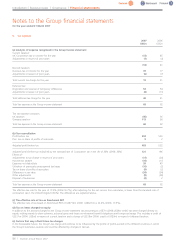
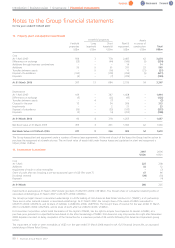
8. Net financing costs
2007 2006
US$m US$m
(a) Net financing costs comprise:
Interest income:
Bank deposits 10 5
Loan notes (note 18) 114
Interest differentials on derivatives 17 45
Expected return on pension scheme assets 68 54
Interest income 96 118
Financing fair value gains:
Fair value gains on non-hedging derivatives 723
Ineffective portion of net investment hedges –5
Financing fair value gains 728
Finance income 103 146
Interest expense:
Bank loans and overdrafts 41 64
Eurobonds and notes 112 107
Commitment and facility utilisation fees 22
Interest expense on pension scheme liabilities 52 45
Interest expense 207 218
Financing fair value losses:
Ineffective portion of fair value hedges of borrowings 55
Fair value losses on non-hedging derivatives 26 –
Foreign exchange transaction losses 11 25
Financing fair value losses 42 30
Finance expense 249 248
Net financing costs 146 102
(b) Net interest expense included in Benchmark PBT comprises:
Net financing costs 146 102
Less: financing fair value remeasurements (35) (2)
Net interest expense included in Benchmark PBT 111 100
(c) Financing fair value remeasurements included in net financing costs comprise:
Financing fair value gains 728
Financing fair value losses (42) (30)
Charge in respect of financing fair value remeasurements (35) (2)
Experian Annual Report2007 |83