Experian 2007 Annual Report Download - page 33
Download and view the complete annual report
Please find page 33 of the 2007 Experian annual report below. You can navigate through the pages in the report by either clicking on the pages listed below, or by using the keyword search tool below to find specific information within the annual report.-
 1
1 -
2
-
3
-
4
-
5
-
6
-
7
-
8
-
9
-
10
-
11
-
12
-
13
-
14
-
15
-
16
-
17
-
18
-
19
-
20
-
21
-
22
-
 23
23 -
 24
24 -
 25
25 -
 26
26 -
 27
27 -
 28
28 -
 29
29 -
 30
30 -
 31
31 -
 32
32 -
 33
33 -
 34
34 -
 35
35 -
 36
36 -
 37
37 -
 38
38 -
 39
39 -
 40
40 -
 41
41 -
 42
42 -
 43
43 -
44
-
45
-
46
-
47
-
48
-
49
-
50
-
51
-
52
-
53
-
54
-
55
-
56
-
57
-
58
-
59
-
60
-
61
-
62
-
63
-
64
-
65
-
66
-
67
-
68
-
69
-
70
-
71
-
72
-
73
-
74
-
75
-
76
-
77
-
78
-
79
-
80
-
81
-
82
-
83
-
84
-
85
-
86
-
87
-
88
-
89
-
90
-
91
-
92
-
93
-
94
-
95
-
96
-
97
-
98
-
99
-
100
-
101
-
102
-
103
-
104
-
105
-
106
-
107
-
108
-
109
-
110
-
111
-
112
-
113
-
114
-
115
-
116
-
117
-
118
-
119
-
120
-
121
-
122
-
123
-
124
-
125
-
126
-
127
-
128
-
129
-
130
-
131
-
132
-
133
-
134
-
135
-
136
-
137
-
138
 |
 |

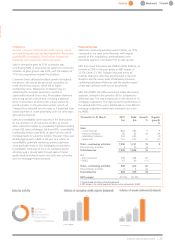
Experian Annual Report 2007 |31
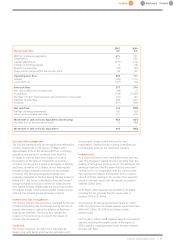
2007 2006
Group cash flow $m $m
EBIT for continuing operations 825 727
Depreciation 237 204
Capital expenditure (275) (212)
Change in working capital 5 (12)
Retained in associate (22) (20)
Share option charge within benchmark profit 34 30
Operating cash flow 804 717
Interest (106) (111)
Corporation tax (121) (32)
Free cash flow 577 574
Net cash outflow from exceptionals (98) (7)
Acquisitions (118) (1,420)
Purchase of other financial assets and investment in associates (42) (41)
Disposal of subsidiary 258 643
Dividends (401) (508)
Net cash flow 176 (759)
Foreign exchange movements 166 (20)
Other investing related cash flows 121 618
Movement in cash and cash equivalents (continuing) 463 (161)
Net debt flow of discontinued activities 32 (188)
Movement in cash and cash equivalents 495 (349)
Currency risk management
The Group’s reported profit can be significantly affected by
currency movements. In the year to 31 March 2007
approximately 35% of the Group’s EBIT from continuing
operations was earned in currencies other than the
US dollar. In order to reduce the impact of currency
fluctuations on the value of investments in overseas
countries, the Group has a policy of borrowing in Sterling
and Euros, as well as in US dollars, and of entering into
forward foreign exchange contracts in its key overseas
currencies. The Group’s principal borrowings were
originally undertaken in Sterling. During the year ended 31
March 2007, the Group continued to enter into forward
foreign exchange contracts to sell the US dollar and the
Euro against Sterling. Additionally, the Group has a policy
of hedging foreign currency denominated transactions by
entering into forward foreign exchange contracts.
Interest rate risk management
The Group’s interest rate exposure is managed by the use
of fixed and floating rate borrowings and by the use of
interest rate swaps to adjust the balance of fixed and
floating rate liabilities. The Group also spreads the
duration of its borrowings to smooth the impact of
interest rate fluctuations.
Credit risk
The Group‘s exposure to credit risk is managed by
dealing only with banks and financial institutions with
strong credit ratings, within limits set for each
organisation. Dealing activity is closely controlled and
counter-party positions are monitored regularly.
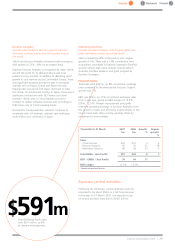
Interest costs
At $146m net finance costs were $44m lower than last
year. The changes in capital structure resulting from the
settling of intra-group lending prior to the demerger, the
demerger itself and the IPO mean that the prior year’s
interest cost is not comparable with the current year’s.
The reported net interest line benefits from a credit to
interest of $16m relating to the excess of the expected
return on pension assets over the interest on pension
liabilities (2006: $9m).
At 31 March 2007, Experian had net debt of $1,408m,
including the net proceeds from the equity issue in
October 2006 of $1,441m.
Assuming the $1.4bn equity had been raised at 1 April
2006, the pro forma net interest expense would have been
$65m (H1: $30m; H2: $35m), including a similar
pension credit.
For the year to March 2008, Experian expects a net interest
expense, including the pension credit, in the region of
$70m, based on acquistion spend since the year-end and
forecast cash flows.