Experian 2007 Annual Report Download - page 102
Download and view the complete annual report
Please find page 102 of the 2007 Experian annual report below. You can navigate through the pages in the report by either clicking on the pages listed below, or by using the keyword search tool below to find specific information within the annual report.-
 1
1 -
2
-
3
-
4
-
5
-
6
-
7
-
8
-
9
-
10
-
11
-
12
-
13
-
14
-
15
-
16
-
17
-
18
-
19
-
20
-
21
-
22
-
23
-
24
-
25
-
26
-
27
-
28
-
29
-
30
-
31
-
32
-
33
-
34
-
35
-
36
-
37
-
38
-
39
-
40
-
41
-
42
-
43
-
44
-
45
-
46
-
47
-
48
-
49
-
50
-
51
-
52
-
53
-
54
-
55
-
56
-
57
-
58
-
59
-
60
-
61
-
62
-
63
-
64
-
65
-
66
-
67
-
68
-
69
-
70
-
71
-
72
-
73
-
74
-
75
-
76
-
77
-
78
-
79
-
80
-
81
-
82
-
83
-
84
-
85
-
86
-
87
-
88
-
89
-
90
-
91
-
 92
92 -
 93
93 -
 94
94 -
 95
95 -
 96
96 -
 97
97 -
 98
98 -
 99
99 -
 100
100 -
 101
101 -
 102
102 -
 103
103 -
 104
104 -
 105
105 -
 106
106 -
 107
107 -
 108
108 -
 109
109 -
 110
110 -
 111
111 -
 112
112 -
113
-
114
-
115
-
116
-
117
-
118
-
119
-
120
-
121
-
122
-
123
-
124
-
125
-
126
-
127
-
128
-
129
-
130
-
131
-
132
-
133
-
134
-
135
-
136
-
137
-
138
 |
 |

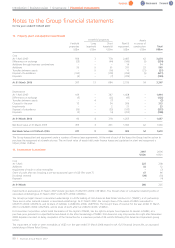
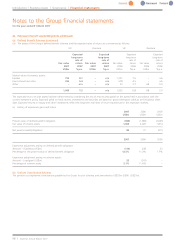
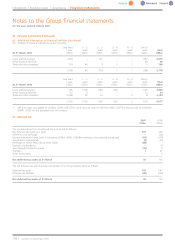
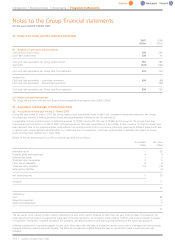
26 Financial instruments
(a) Fair values of financial assets and liabilities
Set out below is a comparison of carrying values and fair values of the Group’s financial instruments:
Carrying Fair Carrying Fair
value value value value
2007 2007 2006 2006
US$m US$m US$m US$m
Trade and other receivables1660 660 1,611 1,611
Other financial assets 127 127 168 168
Cash and cash equivalents 907 907 385 385
Financial assets 1,694 1,694 2,164 2,164
Loans and Borrowings
€548m 4.125% Euronotes 2007 751 751 688 690
£350m 6.375% Eurobonds 2009 721 722 620 622
£334m 5.625% Euronotes 2013 627 630 595 599
Perpetual Securities ––386 390
Bank loans ––1,358 1,358
Overdrafts 273 273 245 245
2,372 2,376 3,892 3,904
Other financial liabilities 40 40 51 51
Trade and other payables2766 766 2,134 2,134
Financial liabilities 3,178 3,182 6,077 6,089
1. VAT recoverable of US$1m (2006: US$17m) and prepayments of US$144m (2006: US$291m) areexcluded from this analysis.
2. VAT and other tax payable of US$42m (2006: US$125m), social security costs of US$75m (2006: US$75m) and accruals of US$200m
(2006: US$231m) areexcluded from this analysis.
Introduction | Business review | Governance | Financial statements
Notes to the Group financial statements
for the year ended 31 March 2007
100 |Experian Annual Report2007