Experian 2007 Annual Report Download - page 62
Download and view the complete annual report
Please find page 62 of the 2007 Experian annual report below. You can navigate through the pages in the report by either clicking on the pages listed below, or by using the keyword search tool below to find specific information within the annual report.-
 1
1 -
2
-
3
-
4
-
5
-
6
-
7
-
8
-
9
-
10
-
11
-
12
-
13
-
14
-
15
-
16
-
17
-
18
-
19
-
20
-
21
-
22
-
23
-
24
-
25
-
26
-
27
-
28
-
29
-
30
-
31
-
32
-
33
-
34
-
35
-
36
-
37
-
38
-
39
-
40
-
41
-
42
-
43
-
44
-
45
-
46
-
47
-
48
-
49
-
50
-
51
-
 52
52 -
 53
53 -
 54
54 -
 55
55 -
 56
56 -
 57
57 -
 58
58 -
 59
59 -
 60
60 -
 61
61 -
 62
62 -
 63
63 -
 64
64 -
 65
65 -
 66
66 -
 67
67 -
 68
68 -
 69
69 -
 70
70 -
 71
71 -
 72
72 -
73
-
74
-
75
-
76
-
77
-
78
-
79
-
80
-
81
-
82
-
83
-
84
-
85
-
86
-
87
-
88
-
89
-
90
-
91
-
92
-
93
-
94
-
95
-
96
-
97
-
98
-
99
-
100
-
101
-
102
-
103
-
104
-
105
-
106
-
107
-
108
-
109
-
110
-
111
-
112
-
113
-
114
-
115
-
116
-
117
-
118
-
119
-
120
-
121
-
122
-
123
-
124
-
125
-
126
-
127
-
128
-
129
-
130
-
131
-
132
-
133
-
134
-
135
-
136
-
137
-
138
 |
 |

Introduction | Business review | Governance | Financial statements
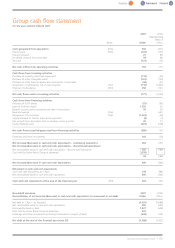
Group income statement
for the year ended 31 March 2007
60 |Experian Annual Report2007
2007 2006
(Represented)
(Note 2)
Notes US$m US$m
Revenue 33,481 3,064
Cost of sales (1,681) (1,507)
Gross profit 1,800 1,557
Distribution costs (301) (272)
Administrative expenses (1,026) (699)
Operating expenses (1,327) (971)
Operating profit 473 586
Finance income 103 146
Finance expense (249) (248)
Net financing costs 8 (146) (102)
Shareof post-tax profits of associates 67 66
Profit before tax 3394 550
Group tax expense 9 (68) (92)
Profit after tax for the financial year from continuing operations 326 458
Profit for the financial year from discontinued operations 10 137 606
Profit for the financial year 463 1,064
Attributable to:
Equity shareholders in the parent company 462 1,018
Minority interests 146
Profit for the financial year 463 1,064
Earnings per share 12 cents cents
–Basic 49.9 107.5
–Diluted 49.3 105.8
Earnings per share from continuing operations 12 cents cents
–Basic 35.1 48.4
–Diluted 34.7 47.6
Non-GAAP measures 2007 2006
Reconciliation of profit beforetax to Benchmark PBT US$m US$m
Profit beforetax 3394 550
exclude: exceptional items 7 162 7
exclude: amortisation of acquisition intangibles 7 76 66
exclude: goodwill adjustment 7 14 –
exclude: charges in respect of the demerger-related equity incentive plans 7 24 –
exclude: financing fair value remeasurements 7 35 2
exclude: tax expense on shareof profit of associates 3 92
Benchmark PBT – continuing operations 3714 627
Benchmark earnings per share from continuing operations 12 cents cents
–Basic 59.7 54.5
–Diluted 59.1 53.6
cents cents
Full year dividend per share 11 17.0 57.5