Wells Fargo 2006 Annual Report Download - page 99
Download and view the complete annual report
Please find page 99 of the 2006 Wells Fargo annual report below. You can navigate through the pages in the report by either clicking on the pages listed below, or by using the keyword search tool below to find specific information within the annual report.-
 1
1 -
2
-
3
-
4
-
5
-
6
-
7
-
8
-
9
-
10
-
11
-
12
-
13
-
14
-
15
-
16
-
17
-
18
-
19
-
20
-
21
-
22
-
23
-
24
-
25
-
26
-
27
-
28
-
29
-
30
-
31
-
32
-
33
-
34
-
35
-
36
-
37
-
38
-
39
-
40
-
41
-
42
-
43
-
44
-
45
-
46
-
47
-
48
-
49
-
50
-
51
-
52
-
53
-
54
-
55
-
56
-
57
-
58
-
59
-
60
-
61
-
62
-
63
-
64
-
65
-
66
-
67
-
68
-
69
-
70
-
71
-
72
-
73
-
74
-
75
-
76
-
77
-
78
-
79
-
80
-
81
-
82
-
83
-
84
-
85
-
86
-
87
-
88
-
 89
89 -
 90
90 -
 91
91 -
 92
92 -
 93
93 -
 94
94 -
 95
95 -
 96
96 -
 97
97 -
 98
98 -
 99
99 -
 100
100 -
 101
101 -
 102
102 -
 103
103 -
 104
104 -
 105
105 -
 106
106 -
 107
107 -
 108
108 -
 109
109 -
110
-
111
-
112
-
113
-
114
-
115
-
116
-
117
-
118
-
119
-
120
-
121
-
122
-
123
-
124
-
125
-
126
-
127
-
128
 |
 |

97
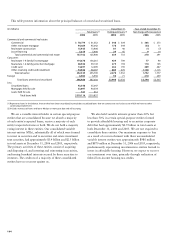
Year ended December 31,
2006 2005 2004
Pension Other Pension Other Pension Other
benefits(1) benefits benefits (1) benefits benefits(1) benefits
Discount rate 5.75% 5.75% 6.0% 6.0% 6.5% 6.5%
Expected return on plan assets 8.75 8.75 9.0 9.0 9.0 9.0
Rate of compensation increase 4.0 — 4.0 — 4.0 —
(1) Includes both qualified and nonqualified pension benefits.
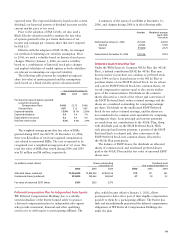
The weighted-average assumptions used to determine the net periodic benefit cost were:
The long-term rate of return assumptions above were
derived based on a combination of factors including
(1) long-term historical return experience for major asset
class categories (for example, large cap and small cap
domestic equities, international equities and domestic fixed
income), and (2) forward-looking return expectations for
these major asset classes.
To account for postretirement health care plans we use
health care cost trend rates to recognize the effect of expected
changes in future health care costs due to medical inflation,
utilization changes, new technology, regulatory requirements
and Medicare cost shifting. We assumed average annual
increases of 9% (before age 65) and 10% (after age 65)
for health care costs for 2007. The rates of average annual
increases are assumed to trend down 1% each year until the
trend rates reach an ultimate trend of 5% in 2011 (before
age 65) and 2012 (after age 65). Increasing the assumed
health care trend by one percentage point in each year would
increase the benefit obligation as of December 31, 2006,
by $52 million and the total of the interest cost and service
cost components of the net periodic benefit cost for 2006
by $4 million. Decreasing the assumed health care trend by
one percentage point in each year would decrease the benefit
obligation as of December 31, 2006, by $46 million and
the total of the interest cost and service cost components
of the net periodic benefit cost for 2006 by $3 million.
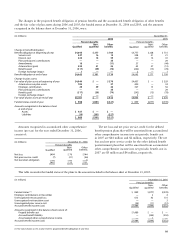
The investment strategy for assets held in the Retiree
Medical Plan Voluntary Employees’ Beneficiary Association
(VEBA) trust and other pension plans is maintained separate
from the strategy for the assets in the Cash Balance Plan.
The general target asset mix is 55–65% equities and
35–45% fixed income. In addition, the strategy for the
VEBA trust assets considers the effect of income taxes by
utilizing a combination of variable annuity and low turnover
investment strategies. Members of the EBRC formally review
the investment risk and performance of these assets on a
quarterly basis.
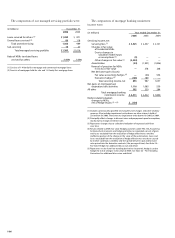
Other benefits payments are expected to be reduced by
prescription drug subsidies from the federal government
provided by the Medicare Prescription Drug, Improvement
and Modernization Act of 2003, as follows:
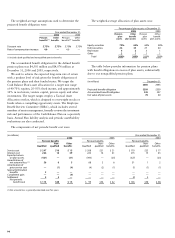
(in millions) Pension benefits Other
Qualified Non-qualified benefits
Year ended December 31,
2007 $ 354 $ 33 $ 54
2008 410 32 57
2009 403 40 59
2010 384 34 62
2011 325 38 65
2012-2016 2,185 174 348
Future benefits, reflecting expected future service that
we expect to pay under the pension and other benefit
plans, follow.
(in millions) Year ended December 31,
2006 2005 2004
Outside professional services $942 $835 $669
Contract services 579 596 626
Travel and entertainment 542 481 442
Advertising and promotion 456 443 459
Outside data processing 437 449 418
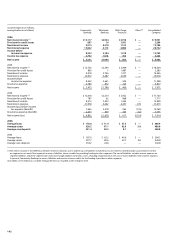
Other Expenses
Expenses exceeding 1% of total interest income and noninterest
income that are not otherwise shown separately in the financial
statements or Notes to Financial Statements were:
(in millions) Other benefits
subsidy receipts
Year ended December 31,
2007 $ 7
2008 7
2009 8
2010 8
2011 8
2012-2016 45