Wells Fargo 2006 Annual Report Download - page 127
Download and view the complete annual report
Please find page 127 of the 2006 Wells Fargo annual report below. You can navigate through the pages in the report by either clicking on the pages listed below, or by using the keyword search tool below to find specific information within the annual report.-
 1
1 -
2
-
3
-
4
-
5
-
6
-
7
-
8
-
9
-
10
-
11
-
12
-
13
-
14
-
15
-
16
-
17
-
18
-
19
-
20
-
21
-
22
-
23
-
24
-
25
-
26
-
27
-
28
-
29
-
30
-
31
-
32
-
33
-
34
-
35
-
36
-
37
-
38
-
39
-
40
-
41
-
42
-
43
-
44
-
45
-
46
-
47
-
48
-
49
-
50
-
51
-
52
-
53
-
54
-
55
-
56
-
57
-
58
-
59
-
60
-
61
-
62
-
63
-
64
-
65
-
66
-
67
-
68
-
69
-
70
-
71
-
72
-
73
-
74
-
75
-
76
-
77
-
78
-
79
-
80
-
81
-
82
-
83
-
84
-
85
-
86
-
87
-
88
-
89
-
90
-
91
-
92
-
93
-
94
-
95
-
96
-
97
-
98
-
99
-
100
-
101
-
102
-
103
-
104
-
105
-
106
-
107
-
108
-
109
-
110
-
111
-
112
-
113
-
114
-
115
-
116
-
 117
117 -
 118
118 -
 119
119 -
 120
120 -
 121
121 -
 122
122 -
 123
123 -
 124
124 -
 125
125 -
 126
126 -
 127
127 -
 128
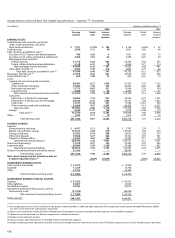
128
 |
 |

02 03 04 05 06
Revenue billions
20-year compound annual growth rate: 12%
$25.2
28.4
30.1
32.9
35.7
03 04 05 06
Active Online Middle-Market/
Large Corporate Customers
thousands
18
02
22
25
28
32
03 04 05 06
Active Online
Banking Customers
millions
3.5
02
4.9
6.2
7.2
8.5
03 04 05 06
Active Online
Small Business Customers
thousands
297
02
415
531
666
833
02 03 04 05 06
Core Deposits
billions
acquired in our markets, stable source
of funds for lending
$198
211
230
253
270
02 03 04 05 06
Mortgage Originations
billions
includes “co-issue” (servicing acquired,
without credit risk)
$333
470
298
366
398
02 03 04 05 06
Mortgage Servicing
Portfolio
billions
$581
710
805
989
1,366
National Home Equity
Group Loans
billions
02 03 04 05 06
$34
49
70
72
79
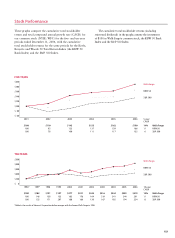
Which Measures Really Matter?
02 03 04 05 06
Earnings Per Share diluted*
20-year compound annual growth rate: 14%
$1.66
1.83
2.25
2.05
2.49
* reflects two-for-one stock split 8/11/06
02 03 04 05 06
Return on Equity (ROE)
18.7%
19.4
19.6
19.6
19.7
cents earned for every dollar
stockholders invest in the company
03 04 05 06
Retaining Households
annual percent of high-value* banking
households that leave us
7.1
* top 20 percent of banking households
based on balances
5.9
5.8
5.6
02 03 04 05 06
Assets Managed,
Administered
billions, includes brokerage
$578
654
791
880
1,098
03 04 05 06
Nonperforming Loans*
/Total Loans
0.58
02
0.78%
0.47
0.43
0.52
* loans not earning interest
03 04 05 06
Products Per Banking
Household
4.2
02
4.3
4.6
4.8
5.2
03 04 05 06
Product Solutions (Sales)
Per Banker* Per Day
4.3
02
4.7
* platform full-time equivalent (FTE)
team member
4.8
4.9
5.0
03 04 05 06
Product Solutions (Sales)
Retail Banking
10.5
02
11.7
millions
13.9
15.9
18.7
03 04 05 06
Team Member Engagement
ratio of engaged to actively disengaged
Gallup survey of Wells Fargo Regional
Banking team members
2.5:1
4.1:1
National Avg
5.8:1
7.1:1
1.9 : 1
02 03 04 05 06
Market Capitalization
billions
$79
100
105
105
120
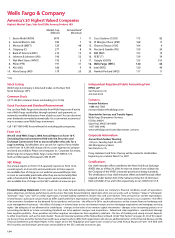
The higher a company’s credit rating
(based on its ability to meet debt obli-
gations), the less interest it has to
pay to borrow money. Wells Fargo Bank
has highest credit rating from Moody’s
and highest credit rating for a U.S. bank
from S&P.
Number of S&P 500
Moody’s companies with
higher rating
Wells Fargo Bank, N.A.
Issuer Aaa None
Long-term Deposits Aaa None
Financial Strength A None
Wells Fargo & Company
Subordinated Debt Aa2 One
Issuer Aa1 Five
Senior Debt Aa1 Five
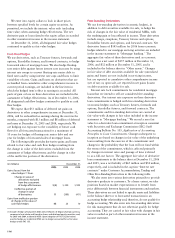
Financial Performance
Retaining Customers,Team Member Engagement
Sales
Online
Earning More Business
Managing Risk
In our past three annual reports, we said to you, our owners, that
we measure success differently than our competitors—to reflect
more accurately how financial services companies, like ours,
create value for customers and stockholders. Here’s an update
on the progress we’re making in the areas we believe are the best
long-term indicators for success in the financial services industry.
03 04 05 06
Commercial/Corporate
Products Per Banking
Customer
02
4.9
5.0
5.3
5.7
6.0
03 04 05 06
Retail Banking Households
with Credit Cards
02
23.7%
26.9
31.1
33.1
35.1