Wells Fargo 2006 Annual Report Download - page 43
Download and view the complete annual report
Please find page 43 of the 2006 Wells Fargo annual report below. You can navigate through the pages in the report by either clicking on the pages listed below, or by using the keyword search tool below to find specific information within the annual report.-
 1
1 -
2
-
3
-
4
-
5
-
6
-
7
-
8
-
9
-
10
-
11
-
12
-
13
-
14
-
15
-
16
-
17
-
18
-
19
-
20
-
21
-
22
-
23
-
24
-
25
-
26
-
27
-
28
-
29
-
30
-
31
-
32
-
 33
33 -
 34
34 -
 35
35 -
 36
36 -
 37
37 -
 38
38 -
 39
39 -
 40
40 -
 41
41 -
 42
42 -
 43
43 -
 44
44 -
 45
45 -
 46
46 -
 47
47 -
 48
48 -
 49
49 -
 50
50 -
 51
51 -
 52
52 -
 53
53 -
54
-
55
-
56
-
57
-
58
-
59
-
60
-
61
-
62
-
63
-
64
-
65
-
66
-
67
-
68
-
69
-
70
-
71
-
72
-
73
-
74
-
75
-
76
-
77
-
78
-
79
-
80
-
81
-
82
-
83
-
84
-
85
-
86
-
87
-
88
-
89
-
90
-
91
-
92
-
93
-
94
-
95
-
96
-
97
-
98
-
99
-
100
-
101
-
102
-
103
-
104
-
105
-
106
-
107
-
108
-
109
-
110
-
111
-
112
-
113
-
114
-
115
-
116
-
117
-
118
-
119
-
120
-
121
-
122
-
123
-
124
-
125
-
126
-
127
-
128
 |
 |

41
Earnings Performance
Net Interest Income
Net interest income is the interest earned on debt securities,
loans (including yield-related loan fees) and other interest-
earning assets minus the interest paid for deposits and long-
term and short-term debt. The net interest margin is the
average yield on earning assets minus the average interest
rate paid for deposits and our other sources of funding. Net
interest income and the net interest margin are presented on
a taxable-equivalent basis to consistently reflect income from
taxable and tax-exempt loans and securities based on a 35%
marginal tax rate.
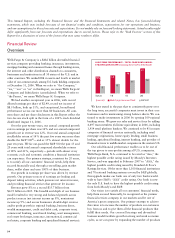
Net interest income on a taxable-equivalent basis was
$20.1 billion in 2006, compared with $18.6 billion in 2005,
an increase of 8%, reflecting solid loan growth (other than
ARMs) and a relatively stable net interest margin. In 2006,
we incurred noninterest expense of $31 million on the extin-
guishment of approximately $800 million of trust preferred
securities (included in junior subordinated long-term debt).
Because we were able to refinance this debt at a rate approx-
imately 200 basis points lower, our net interest expense will
be reduced by approximately $320 million over the next
twenty years.
Our net interest margin was 4.83% for 2006 and 4.86%
for 2005. With short-term interest rates now above 5%, our
cumulative sales of ARMs and debt securities since mid-2004
have had a positive impact on our net interest margin and net
interest income. We have completed our sales of over $90 billion
of ARMs since mid-2004 with the sales of $26 billion of ARMs
in second quarter 2006. In addition, taking advantage of
market volatility during second quarter 2006, we sold our
lowest-yielding debt securities and added to our portfolio of
long-term debt securities at yields of approximately 6.25%
—nearly 200 basis points higher than the cyclical low in yields.
Average earning assets increased $32.3 billion to
$415.8 billion in 2006 from $383.5 billion in 2005. Loans
averaged $306.9 billion in 2006, compared with $296.1 billion
in 2005. Average mortgages held for sale were $42.9 billion
in 2006 and $39.0 billion in 2005. Debt securities available for
sale averaged $53.6 billion in 2006 and $33.1 billion in 2005.
Average core deposits are an important contributor to
growth in net interest income and the net interest margin.
This low-cost source of funding rose 7% from 2005. Average
core deposits were $260.0 billion and $242.8 billion and
funded 53.5% and 54.5% of average total assets in 2006
and 2005, respectively. Total average retail core deposits,
which exclude Wholesale Banking core deposits and retail
mortgage escrow deposits, for 2006 grew $12.0 billion, or
6%, from 2005. Average mortgage escrow deposits were
$18.2 billion in 2006 and $16.7 billion in 2005. Savings
certificates of deposits increased on average to $32.4 billion
in 2006 from $22.6 billion in 2005 and noninterest-bearing
checking accounts and other core deposit categories increased
on average to $227.7 billion in 2006 from $220.1 billion in 2005.
Total average interest-bearing deposits increased to
$223.8 billion in 2006 from $194.6 billion in 2005, largely
due to organic growth.
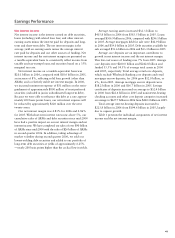
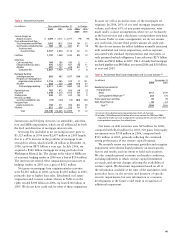
Table 3 presents the individual components of net interest
income and the net interest margin.