Wells Fargo 2006 Annual Report Download - page 47
Download and view the complete annual report
Please find page 47 of the 2006 Wells Fargo annual report below. You can navigate through the pages in the report by either clicking on the pages listed below, or by using the keyword search tool below to find specific information within the annual report.-
 1
1 -
2
-
3
-
4
-
5
-
6
-
7
-
8
-
9
-
10
-
11
-
12
-
13
-
14
-
15
-
16
-
17
-
18
-
19
-
20
-
21
-
22
-
23
-
24
-
25
-
26
-
27
-
28
-
29
-
30
-
31
-
32
-
33
-
34
-
35
-
36
-
 37
37 -
 38
38 -
 39
39 -
 40
40 -
 41
41 -
 42
42 -
 43
43 -
 44
44 -
 45
45 -
 46
46 -
 47
47 -
 48
48 -
 49
49 -
 50
50 -
 51
51 -
 52
52 -
 53
53 -
 54
54 -
 55
55 -
 56
56 -
 57
57 -
58
-
59
-
60
-
61
-
62
-
63
-
64
-
65
-
66
-
67
-
68
-
69
-
70
-
71
-
72
-
73
-
74
-
75
-
76
-
77
-
78
-
79
-
80
-
81
-
82
-
83
-
84
-
85
-
86
-
87
-
88
-
89
-
90
-
91
-
92
-
93
-
94
-
95
-
96
-
97
-
98
-
99
-
100
-
101
-
102
-
103
-
104
-
105
-
106
-
107
-
108
-
109
-
110
-
111
-
112
-
113
-
114
-
115
-
116
-
117
-
118
-
119
-
120
-
121
-
122
-
123
-
124
-
125
-
126
-
127
-
128
 |
 |

45
Instruments and Hedging Activities (as amended)), amortiza-
tion and MSRs impairment, which are all influenced by both
the level and direction of mortgage interest rates.
Servicing fees (included in net servicing income) grew to
$3,525 million in 2006 from $2,457 million in 2005 largely
due to a 47% increase in the portfolio of mortgage loans
serviced for others, which was $1.28 trillion at December 31,
2006, up from $871 billion a year ago. In July 2006, we
acquired a $140 billion mortgage servicing portfolio from
Washington Mutual, Inc. The change in the value of MSRs net
of economic hedging results in 2006 was a loss of $154 million.
The interest rate-related effect (impairment provision net of
hedging results) in 2005 was a gain of $521 million.
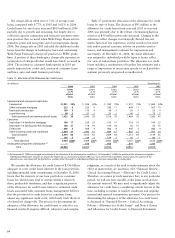
Net gains on mortgage loan origination/sales activities
were $1,116 million in 2006, up from $1,085 million in 2005,
primarily due to higher loan sales. Residential real estate
origination and co-issue volume (shown in Table 6 on the
right) totaled $398 billion in 2006, up from $366 billion in
2005. We do not have credit risk for most of these originations
Net losses on debt securities were $19 million for 2006,
compared with $120 million for 2005. Net gains from equity
investments were $738 million in 2006, compared with
$511 million in 2005, primarily reflecting the continued
strong performance of our venture capital business.
We routinely review our investment portfolios and recognize
impairment write-downs based primarily on issuer-specific
factors and results, and our intent to hold such securities.
We also consider general economic and market conditions,
including industries in which venture capital investments
are made, and adverse changes affecting the availability of
venture capital. We determine impairment based on all of
the information available at the time of the assessment, with
particular focus on the severity and duration of specific
security impairments, but new information or economic
developments in the future could result in recognition of
additional impairment.
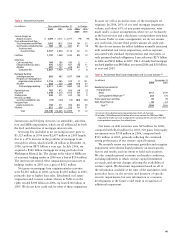
Table 5: Noninterest Income
(in millions) Year ended December 31, % Change
2006 2005 2004 2006/ 2005/
2005 2004
Service charges on
deposit accounts $ 2,690 $ 2,512
$ 2,417 7% 4%
Trust and investment fees:
Trust,investment and IRA fees 2,033 1,855
1,509 10 23
Commissions and all other fees
704 581 607 21 (4)
Total trust and
investment fees
2,737 2,436 2,116 12 15
Card fees
1,747 1,458 1,230 20 19
Other fees:
Cash network fees
184 180 180 2—
Charges and fees on loans
976 1,022 921 (5) 11
All other
897 727 678 23 7
Total other fees
2,057 1,929 1,779 78
Mortgage banking:
Servicing income,net
893 987 1,037 (10) (5)
Net gains on mortgage loan
origination/sales activities
1,116 1,085 539 3101
All other
302 350 284 (14) 23
Total mortgage banking
2,311 2,422 1,860 (5) 30
Operating leases
783 812 836 (4) (3)
Insurance
1,340 1,215 1,193 10 2
Trading assets
544 571 523 (5) 9
Net losses on debt
securities available for sale
(19) (120) (15) (84) 700
Net gains from
equity investments
738 511 394 44 30
All other
812 699 576 16 21
Total
$15,740 $14,445 $12,909 912
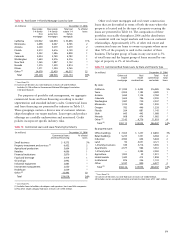
Table 6: Residential Real Estate Origination and Co-Issue Volume (1)
(in billions) December 31,
2006 2005
Residential real estate first
mortgage loans:
Retail
$117 $139
Correspondent/Wholesale
(2) 232 176
Home equity loans and lines
39 39
Wells Fargo Financial
10 12
Total
(2) $398 $366
(1) Consists of residential real estate originations from all channels.
(2) Includes $104 billion and $48 billion of co-issue volume for 2006 and 2005,
respectively. Under co-issue arrangements, we become the servicer when the
correspondent securitizes the related loans.
because we sell or securitize most of the mortgages we
originate. In 2006, 26% of our total mortgage origination
volume, and about 65% of non-prime originations, were
made under co-issue arrangements, where we act exclusively
as the loan servicer and a third party correspondent securitizes
the loans. Under co-issue arrangements, we do not assume
any credit risk, because third parties assume all credit risk.
We also do not assume the seller’s liabilities normally associated
with residential real estate originations, such as exposure
associated with standard representations and warranties or
early payment buyback obligations. Loan sales were $271 billion
in 2006 and $251 billion in 2005. The 1-4 family first mortgage
unclosed pipeline was $48 billion at year-end 2006 and $50 billion
at year-end 2005.