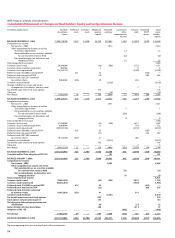
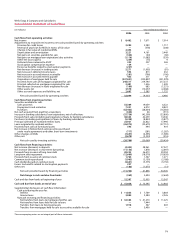
Wells Fargo 2006 Annual Report Download - page 81
Download and view the complete annual report
Please find page 81 of the 2006 Wells Fargo annual report below. You can navigate through the pages in the report by either clicking on the pages listed below, or by using the keyword search tool below to find specific information within the annual report.-
 1
1 -
2
-
3
-
4
-
5
-
6
-
7
-
8
-
9
-
10
-
11
-
12
-
13
-
14
-
15
-
16
-
17
-
18
-
19
-
20
-
21
-
22
-
23
-
24
-
25
-
26
-
27
-
28
-
29
-
30
-
31
-
32
-
33
-
34
-
35
-
36
-
37
-
38
-
39
-
40
-
41
-
42
-
43
-
44
-
45
-
46
-
47
-
48
-
49
-
50
-
51
-
52
-
53
-
54
-
55
-
56
-
57
-
58
-
59
-
60
-
61
-
62
-
63
-
64
-
65
-
66
-
67
-
68
-
69
-
70
-
 71
71 -
 72
72 -
 73
73 -
 74
74 -
 75
75 -
 76
76 -
 77
77 -
 78
78 -
 79
79 -
 80
80 -
 81
81 -
 82
82 -
 83
83 -
 84
84 -
 85
85 -
 86
86 -
 87
87 -
 88
88 -
 89
89 -
 90
90 -
 91
91 -
92
-
93
-
94
-
95
-
96
-
97
-
98
-
99
-
100
-
101
-
102
-
103
-
104
-
105
-
106
-
107
-
108
-
109
-
110
-
111
-
112
-
113
-
114
-
115
-
116
-
117
-
118
-
119
-
120
-
121
-
122
-
123
-
124
-
125
-
126
-
127
-
128
 |
 |

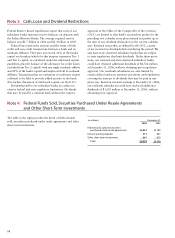
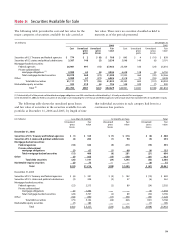
79
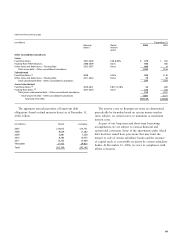
The following table shows the unrealized gross losses
and fair value of securities in the securities available for sale
portfolio at December 31, 2006 and 2005, by length of time
The following table provides the cost and fair value for the
major categories of securities available for sale carried at
Note 5: Securities Available for Sale
fair value. There were no securities classified as held to
maturity as of the periods presented.
that individual securities in each category had been in a
continuous loss position.
(in millions) December 31,
2006 2005
Cost Unrealized Unrealized Fair Cost Unrealized Unrealized Fair
gross gross value gross gross value
gains losses gains losses
Securities of U.S. Treasury and federal agencies $ 774 $ 2 $ (8) $ 768 $ 845 $ 4 $ (10) $ 839
Securities of U.S. states and political subdivisions 3,387 148 (5) 3,530 3,048 149 (6) 3,191
Mortgage-backed securities:
Federal agencies 26,981 497 (15) 27,463 25,304 336 (24) 25,616
Private collateralized
mortgage obligations (1) 3,989 63 (6) 4,046 6,628 128 (6) 6,750
Total mortgage-backed securities 30,970 560 (21) 31,509 31,932 464 (30) 32,366
Other 5,980 67 (21) 6,026 4,518 75 (55) 4,538
Total debt securities 41,111 777 (55) 41,833 40,343 692 (101) 40,934
Marketable equity securities 592 210 (6) 796 558 349 (7) 900
Total (2) $41,703 $987 $(61) $42,629 $40,901 $1,041 $(108) $41,834
(1) Substantially all of the private collateralized mortgage obligations are AAA-rated bonds collateralized by 1-4 family residential first mortgages.
(2) At December 31, 2006, we held no securities of any single issuer (excluding the U.S.Treasury and federal agencies) with a book value that exceeded 10% of stockholders' equity.
(in millions) Less than 12 months 12 months or more Total
Unrealized Fair Unrealized Fair Unrealized Fair
gross value gross value gross value
losses losses losses
December 31, 2006
Securities of U.S. Treasury and federal agencies $ (1) $ 164 $ (7) $ 316 $ (8) $ 480
Securities of U.S. states and political subdivisions (4) 203 (1) 90 (5) 293
Mortgage-backed securities:
Federal agencies (10) 342 (5) 213 (15) 555
Private collateralized
mortgage obligations (5) 67 (1) 68 (6) 135
Total mortgage-backed securities (15) 409 (6) 281 (21) 690
Other (6) 365 (15) 558 (21) 923
Total debt securities (26) 1,141 (29) 1,245 (55) 2,386
Marketable equity securities (6) 75 — — (6) 75
Total $(32) $1,216 $(29) $1,245 $ (61) $2,461
December 31, 2005
Securities of U.S. Treasury and federal agencies $ (6) $ 341 $ (4) $ 142 $ (10) $ 483
Securities of U.S. states and political subdivisions (3) 204 (3) 57 (6) 261
Mortgage-backed securities:
Federal agencies (22) 2,213 (2) 89 (24) 2,302
Private collateralized
mortgage obligations (6) 1,494 — — (6) 1,494
Total mortgage-backed securities (28) 3,707 (2) 89 (30) 3,796
Other (38) 890 (17) 338 (55) 1,228
Total debt securities (75) 5,142 (26) 626 (101) 5,768
Marketable equity securities (7) 185 — — (7) 185
Total $ (82) $ 5,327 $(26) $ 626 $(108) $ 5,953