Wells Fargo 2006 Annual Report Download - page 95
Download and view the complete annual report
Please find page 95 of the 2006 Wells Fargo annual report below. You can navigate through the pages in the report by either clicking on the pages listed below, or by using the keyword search tool below to find specific information within the annual report.-
 1
1 -
2
-
3
-
4
-
5
-
6
-
7
-
8
-
9
-
10
-
11
-
12
-
13
-
14
-
15
-
16
-
17
-
18
-
19
-
20
-
21
-
22
-
23
-
24
-
25
-
26
-
27
-
28
-
29
-
30
-
31
-
32
-
33
-
34
-
35
-
36
-
37
-
38
-
39
-
40
-
41
-
42
-
43
-
44
-
45
-
46
-
47
-
48
-
49
-
50
-
51
-
52
-
53
-
54
-
55
-
56
-
57
-
58
-
59
-
60
-
61
-
62
-
63
-
64
-
65
-
66
-
67
-
68
-
69
-
70
-
71
-
72
-
73
-
74
-
75
-
76
-
77
-
78
-
79
-
80
-
81
-
82
-
83
-
84
-
 85
85 -
 86
86 -
 87
87 -
 88
88 -
 89
89 -
 90
90 -
 91
91 -
 92
92 -
 93
93 -
 94
94 -
 95
95 -
 96
96 -
 97
97 -
 98
98 -
 99
99 -
 100
100 -
 101
101 -
 102
102 -
 103
103 -
 104
104 -
 105
105 -
106
-
107
-
108
-
109
-
110
-
111
-
112
-
113
-
114
-
115
-
116
-
117
-
118
-
119
-
120
-
121
-
122
-
123
-
124
-
125
-
126
-
127
-
128
 |
 |

93
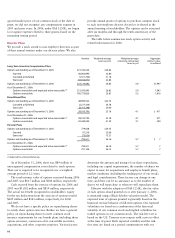
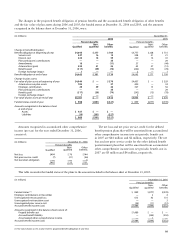
The weighted-average grant-date fair value of RSRs
granted during 2005 was $30.78. At December 31, 2006,
there was $2 million of total unrecognized compensation
cost related to nonvested RSRs. The cost is expected to be
recognized over a weighted-average period of 3.0 years. The
total fair value of RSRs that vested during 2006 and 2005
was $3 million and $4 million, respectively.
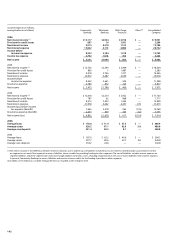
(in millions, except shares) Shares outstanding Dividends paid
__________December 31, Year ended December 31,
2006 2005 2004 2006 2005 2004
Allocated shares (common) 74,536,040 73,835,002 67,843,516 $79 $71 $61
Unreleased shares (preferred) 383,804 325,463 269,563 47 39 32
Fair value of unearned ESOP shares $384 $325 $270
Deferred Compensation Plan for Independent Sales Agents
WF Deferred Compensation Holdings, Inc. is a wholly-
owned subsidiary of the Parent formed solely to sponsor
a deferred compensation plan for independent sales agents
who provide investment, financial and other qualifying
services for or with respect to participating affiliates. The
plan, which became effective January 1, 2002, allows
participants to defer all or part of their eligible compensation
payable to them by a participating affiliate. The Parent has
fully and unconditionally guaranteed the deferred compensation
obligations of WF Deferred Compensation Holdings, Inc.
under the plan.
Employee Stock Ownership Plan
Under the Wells Fargo & Company 401(k) Plan (the 401(k)
Plan), a defined contribution ESOP, the 401(k) Plan may
borrow money to purchase our common or preferred stock.
Since 1994, we have loaned money to the 401(k) Plan to
purchase shares of our ESOP Preferred Stock. As we release
and convert ESOP Preferred Stock into common shares, we
record compensation expense equal to the current market
price of the common shares. Dividends on the common
shares allocated as a result of the release and conversion of
the ESOP Preferred Stock reduce retained earnings and the
shares are considered outstanding for computing earnings
per share. Dividends on the unallocated ESOP Preferred
Stock do not reduce retained earnings, and the shares are
not considered to be common stock equivalents for computing
earnings per share. Loan principal and interest payments
are made from our contributions to the 401(k) Plan, along
with dividends paid on the ESOP Preferred Stock. With
each principal and interest payment, a portion of the ESOP
Preferred Stock is released and, after conversion of the
ESOP Preferred Stock into common shares, allocated to
the 401(k) Plan participants.
The balance of ESOP shares, the dividends on allocated
shares of common stock and unreleased preferred shares
paid to the 401(k) Plan and the fair value of unearned ESOP
shares were:
Number Weighted-average
grant-date
fair value
Nonvested at January 1, 2006 212,366 $26.92
Granted 26,580 33.90
Vested (91,800) 24.75
Nonvested at December 31, 2006 147,146 29.53
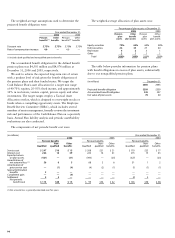
expected term. The expected dividend is based on the current
dividend, our historical pattern of dividend increases and the
current market price of our stock.
Prior to the adoption of FAS 123(R), we also used a
Black-Scholes valuation model to estimate the fair value
of options granted for the pro forma disclosures of net
income and earnings per common share that were required
by FAS 123.
Effective with the adoption of FAS 123(R), we changed
our method of estimating our volatility assumption. Prior
to 2006, we used a volatility based on historical stock price
changes. Effective January 1, 2006, we used a volatility
based on a combination of historical stock price changes
and implied volatilities of traded options as both volatilities
are relevant in estimating our expected volatility.
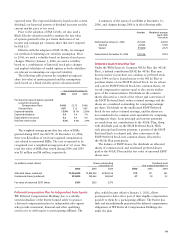
The following table presents the weighted-average per
share fair value of options granted and the assumptions
used, based on a Black-Scholes option valuation model.
A summary of the status of our RSRs at December 31,
2006, and changes during 2006 is in the following table:
Year ended December 31,
2006 2005 2004
Per share fair value of options granted:
Long-Term Incentive
Compensation Plans $4.03 $3.75 $4.66
Director Plans 4.67 3.13 4.67
Expected volatility 15.9% 16.1% 23.8%
Expected dividends 3.4 3.4 3.4
Expected term (in years) 4.3 4.4 4.4
Risk-free interest rate 4.5% 4.0% 2.9%