Wells Fargo 2006 Annual Report Download - page 53
Download and view the complete annual report
Please find page 53 of the 2006 Wells Fargo annual report below. You can navigate through the pages in the report by either clicking on the pages listed below, or by using the keyword search tool below to find specific information within the annual report.-
 1
1 -
2
-
3
-
4
-
5
-
6
-
7
-
8
-
9
-
10
-
11
-
12
-
13
-
14
-
15
-
16
-
17
-
18
-
19
-
20
-
21
-
22
-
23
-
24
-
25
-
26
-
27
-
28
-
29
-
30
-
31
-
32
-
33
-
34
-
35
-
36
-
37
-
38
-
39
-
40
-
41
-
42
-
 43
43 -
 44
44 -
 45
45 -
 46
46 -
 47
47 -
 48
48 -
 49
49 -
 50
50 -
 51
51 -
 52
52 -
 53
53 -
 54
54 -
 55
55 -
 56
56 -
 57
57 -
 58
58 -
 59
59 -
 60
60 -
 61
61 -
 62
62 -
 63
63 -
64
-
65
-
66
-
67
-
68
-
69
-
70
-
71
-
72
-
73
-
74
-
75
-
76
-
77
-
78
-
79
-
80
-
81
-
82
-
83
-
84
-
85
-
86
-
87
-
88
-
89
-
90
-
91
-
92
-
93
-
94
-
95
-
96
-
97
-
98
-
99
-
100
-
101
-
102
-
103
-
104
-
105
-
106
-
107
-
108
-
109
-
110
-
111
-
112
-
113
-
114
-
115
-
116
-
117
-
118
-
119
-
120
-
121
-
122
-
123
-
124
-
125
-
126
-
127
-
128
 |
 |

51
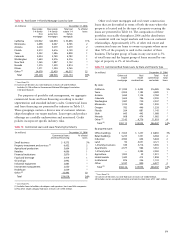
Other real estate mortgages and real estate construction
loans that are diversified in terms of both the state where the
property is located and by the type of property securing the
loans are presented in Table 14. The composition of these
portfolios was stable throughout 2006 and the distribution
is consistent with our target markets and focus on customer
relationships. Approximately 25% of other real estate and
construction loans are loans to owner-occupants where more
than 50% of the property is used in the conduct of their
business. The largest group of loans in any one state is 5%
of total loans and the largest group of loans secured by one
type of property is 3% of total loans.
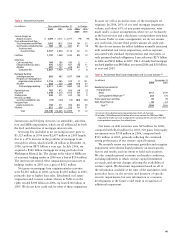
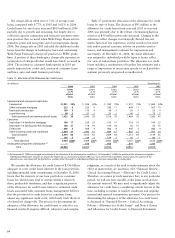
For purposes of portfolio risk management, we aggregate
commercial loans and lease financing according to market
segmentation and standard industry codes. Commercial loans
and lease financing are presented by industry in Table 13.
These groupings contain a diverse mix of customer relation-
ships throughout our target markets. Loan types and product
offerings are carefully underwritten and monitored. Credit
policies incorporate specific industry risks.
Table 13: Commercial Loans and Lease Financing by Industry
(in millions) December 31, 2006
Commercial loans % of total
and lease financing loans
Small business $ 9,575 3%
Property investment and services (1) 6,452 2
Agricultural production 5,604 2
Retailers 4,696 1
Financial institutions 3,870 1
Food and beverage 3,414 1
Oil and gas 2,992 *
Industrial equipment 2,883 *
Investment management 2,050 *
Healthcare 2,039 *
Other (2) 32,443 10
Total $76,018 24%
* Less than 1%.
(1) Includes loans to builders, developers and operators, trusts and title companies.
(2) No other single category had loans in excess of $1,943 million.
Table 12: Real Estate 1-4 Family Mortgage Loans by State
(in millions) December 31, 2006
Real estate Real estate Total real % of total
1-4 family 1-4 family estate 1-4 loans
first junior lien family
mortgage mortgage mortgage
California $10,902 $24,994 $ 35,896 11%
Minnesota 2,698 4,067 6,765 2
Arizona 2,200 3,079 5,279 2
Florida 2,513 2,616 5,129 2
Texas 3,252 1,586 4,838 1
Colorado 2,034 2,749 4,783 1
Washington 1,640 2,576 4,216 1
New York 1,265 1,887 3,152 *
Nevada 1,275 1,539 2,814 *
Illinois 1,371 1,394 2,765 *
Other (1) 24,078 22,439 46,517 15
Total $53,228 $68,926 $122,154 38%
* Less than 1%.
(1) Consists of 40 states; no state had loans in excess of $2,676 million.
Includes $4,156 million in Government National Mortgage Association
early pool buyouts.
Table 14: Commercial Real Estate Loans by State and Property Type
(in millions) December 31, 2006
Other real Real Total % of
estate estate commercial total
mortgage construction real estate loans
By state:
California $11,590 $ 4,495 $16,085 5%
Texas 2,904 1,185 4,089 1
Arizona 1,650 1,134 2,784 *
Colorado 1,604 786 2,390 *
Washington 1,587 720 2,307 *
Minnesota 1,335 595 1,930 *
Oregon 782 446 1,228 *
Florida 264 881 1,145 *
Utah 645 443 1,088 *
Nevada 608 474 1,082 *
Other (1) 7,143 4,776 11,919 4
Total (2) $30,112 $15,935 $46,047 14%
By property type:
Office buildings $ 7,655 $ 1,237 $ 8,892 3%
Retail buildings 5,233 1,351 6,584 2
Industrial 4,960 644 5,604 2
Land 90 4,031 4,121 1
1-4 family structures 189 3,716 3,905 1
Apartments 2,577 984 3,561 1
1-4 family land — 2,382 2,382 *
Agriculture 1,902 29 1,931 *
Hotels/motels 1,443 415 1,858 *
Institutional 876 256 1,132 *
Other 5,187 890 6,077 2
Total (2) $30,112 $15,935 $46,047 14%
* Less than 1%.
(1) Consists of 40 states; no state had loans in excess of $1,002 million.
(2) Includes owner-occupied real estate and construction loans of $11,661 million.