Wells Fargo 2006 Annual Report Download - page 62
Download and view the complete annual report
Please find page 62 of the 2006 Wells Fargo annual report below. You can navigate through the pages in the report by either clicking on the pages listed below, or by using the keyword search tool below to find specific information within the annual report.-
 1
1 -
2
-
3
-
4
-
5
-
6
-
7
-
8
-
9
-
10
-
11
-
12
-
13
-
14
-
15
-
16
-
17
-
18
-
19
-
20
-
21
-
22
-
23
-
24
-
25
-
26
-
27
-
28
-
29
-
30
-
31
-
32
-
33
-
34
-
35
-
36
-
37
-
38
-
39
-
40
-
41
-
42
-
43
-
44
-
45
-
46
-
47
-
48
-
49
-
50
-
51
-
 52
52 -
 53
53 -
 54
54 -
 55
55 -
 56
56 -
 57
57 -
 58
58 -
 59
59 -
 60
60 -
 61
61 -
 62
62 -
 63
63 -
 64
64 -
 65
65 -
 66
66 -
 67
67 -
 68
68 -
 69
69 -
 70
70 -
 71
71 -
 72
72 -
73
-
74
-
75
-
76
-
77
-
78
-
79
-
80
-
81
-
82
-
83
-
84
-
85
-
86
-
87
-
88
-
89
-
90
-
91
-
92
-
93
-
94
-
95
-
96
-
97
-
98
-
99
-
100
-
101
-
102
-
103
-
104
-
105
-
106
-
107
-
108
-
109
-
110
-
111
-
112
-
113
-
114
-
115
-
116
-
117
-
118
-
119
-
120
-
121
-
122
-
123
-
124
-
125
-
126
-
127
-
128
 |
 |

60
Our growth in earnings per share in 2005 compared with
2004 was driven by revenue growth, operating leverage (rev-
enue growth in excess of expense growth) and credit quality,
which remained solid despite the following credit-related events:
• $171 million of net charge-offs from incremental
consumer bankruptcy filings nationwide due to a
change in bankruptcy law in October 2005;
• $163 million first quarter 2005 initial implementation
of conforming to more stringent FFIEC charge-off rules
at Wells Fargo Financial; and
• $100 million provision for credit losses for our
assessment of the effect of Hurricane Katrina.
Results for 2004 included incremental investments in new
stores, sales-focused team members and technology, as well
as $217 million of charitable contribution expense for the
Wells Fargo Foundation. We also took significant actions to
reposition our balance sheet in 2004 designed to improve
earning asset yields and to reduce long-term debt costs. The
extinguishment of high interest rate debt reduced earnings by
$174 million for 2004.
Return on average total assets was 1.72% and return on
average stockholders’ equity was 19.59% in 2005, and
1.71% and 19.57%, respectively, in 2004.
Net interest income on a taxable-equivalent basis was
$18.6 billion in 2005, compared with $17.3 billion in 2004,
reflecting solid loan growth (excluding ARMs) and a rela-
tively flat net interest margin. Average earning assets grew
8% from 2004, or 15% excluding 1-4 family first mortgages
(the loan category impacted by our ARMs sales). Our net
interest margin was 4.86% for 2005, compared with 4.89%
in 2004. Given the prospect of higher short-term interest
rates and a flatter yield curve, beginning in second quarter
2004, as part of our asset/liability management strategy, we
sold the lowest-yielding ARMs on our balance sheet, replac-
ing some of these loans with higher-yielding ARMs. At the
end of 2005, new ARMs being held for investment within
real estate 1-4 family mortgage loans had yields more than
1% higher than the average yield on the ARMs sold since
second quarter 2004.
Noninterest income increased 12% to $14.4 billion in 2005
from $12.9 billion in 2004. Double-digit growth in noninterest
income was driven by growth across our businesses in 2005,
with particular strength in trust, investment and IRA fees,
card fees, loan fees, mortgage banking income and gains on
equity investments.
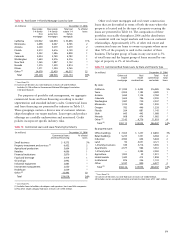
Mortgage banking noninterest income increased to
$2,422 million in 2005 from $1,860 million in 2004, due to
an increase in net gains on mortgage loan origination/sales
activities partly offset by the decline in net servicing income.
Net gains on mortgage loan origination/sales activities
were $1,085 million in 2005, up from $539 million in 2004,
primarily due to higher origination volume.
Net servicing income was $987 million in 2005 compared
with $1,037 million in 2004. The Company’s portfolio of
loans serviced for others was $871 billion at December 31,
2005, up 27% from $688 billion at year-end 2004. Given a
larger servicing portfolio year over year, the increase in ser-
vicing income was partly offset by higher amortization of
MSRs. Servicing fees increased to $2,457 million in 2005
from $2,101 million in 2004 and amortization of MSRs
increased to $1,991 million in 2005 from $1,826 million in
2004. Servicing income in 2005 also included a higher MSRs
valuation allowance release of $378 million in 2005 com-
pared with $208 million in 2004, due to higher long-term
interest rates in certain quarters of 2005. The increase in fee
revenue and the higher MSRs valuation allowance release
were mostly offset by the decrease in net derivative gains to
$143 million in 2005 from $554 million in 2004.
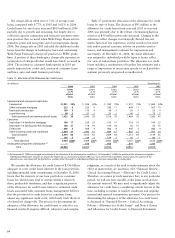
Revenue, the sum of net interest income and noninterest
income, increased 10% to a record $32.9 billion in 2005
from $30.1 billion in 2004 despite balance sheet repositioning
actions, including losses from the sales of low-yielding ARMs
and debt securities. Home Mortgage revenue increased
$455 million, or 10%, to $4.9 billion in 2005 from $4.4 billion
in 2004. Operating leverage improved during 2005 with
revenue growing 10% and noninterest expense up only 8%.
Noninterest expense in 2005 increased 8% to $19.0 billion
from $17.6 billion in 2004, primarily due to increased mort-
gage production and continued investments in new stores
and additional sales-related team members. Noninterest
expense in 2005 included a $117 million expense to adjust
the estimated lives for certain depreciable assets, primarily
building improvements, $62 million of airline lease write-
downs, $56 million of integration expense and $25 million
for the adoption of FIN 47, which relates to recognition
of obligations associated with the retirement of long-lived
assets, such as building and leasehold improvements. Home
Mortgage expenses increased $426 million from 2004,
reflecting higher production costs from an increase in loan
origination volume. For 2004, employee benefits included
a $44 million special 401(k) contribution and charitable
donations included a $217 million contribution to the
Wells Fargo Foundation.
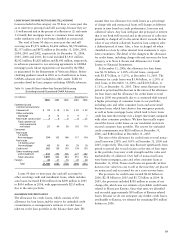
During 2005, net charge-offs were $2.28 billion, or
0.77% of average total loans, compared with $1.67 billion,
or 0.62%, during 2004. Credit losses for 2005 included
$171 million of incremental fourth quarter bankruptcy losses
and increased losses of $163 million for first quarter 2005
initial implementation of conforming Wells Fargo Financial’s
charge-off practices to more stringent FFIEC guidelines. The
provision for credit losses was $2.38 billion in 2005, up
$666 million from $1.72 billion in 2004. The 2005 provision
for credit losses also included $100 million for estimated credit
losses related to Hurricane Katrina. The allowance for credit
losses, which consists of the allowance for loan losses and the
reserve for unfunded credit commitments, was $4.06 billion,
or 1.31% of total loans, at December 31, 2005, compared
with $3.95 billion, or 1.37%, at December 31, 2004.
At December 31, 2005, total nonaccrual loans were
$1.34 billion, or 0.43% of total loans, down from $1.36 billion,
or 0.47%, at December 31, 2004. Foreclosed assets were
$191 million at December 31, 2005, compared with
$212 million at December 31, 2004.