Wells Fargo 2006 Annual Report Download - page 59
Download and view the complete annual report
Please find page 59 of the 2006 Wells Fargo annual report below. You can navigate through the pages in the report by either clicking on the pages listed below, or by using the keyword search tool below to find specific information within the annual report.-
 1
1 -
2
-
3
-
4
-
5
-
6
-
7
-
8
-
9
-
10
-
11
-
12
-
13
-
14
-
15
-
16
-
17
-
18
-
19
-
20
-
21
-
22
-
23
-
24
-
25
-
26
-
27
-
28
-
29
-
30
-
31
-
32
-
33
-
34
-
35
-
36
-
37
-
38
-
39
-
40
-
41
-
42
-
43
-
44
-
45
-
46
-
47
-
48
-
 49
49 -
 50
50 -
 51
51 -
 52
52 -
 53
53 -
 54
54 -
 55
55 -
 56
56 -
 57
57 -
 58
58 -
 59
59 -
 60
60 -
 61
61 -
 62
62 -
 63
63 -
 64
64 -
 65
65 -
 66
66 -
 67
67 -
 68
68 -
 69
69 -
70
-
71
-
72
-
73
-
74
-
75
-
76
-
77
-
78
-
79
-
80
-
81
-
82
-
83
-
84
-
85
-
86
-
87
-
88
-
89
-
90
-
91
-
92
-
93
-
94
-
95
-
96
-
97
-
98
-
99
-
100
-
101
-
102
-
103
-
104
-
105
-
106
-
107
-
108
-
109
-
110
-
111
-
112
-
113
-
114
-
115
-
116
-
117
-
118
-
119
-
120
-
121
-
122
-
123
-
124
-
125
-
126
-
127
-
128
 |
 |

57
affected primarily by changes in interest rates and the passage
of time. The value of the MSRs is recognized only after the
servicing asset has been contractually separated from the
underlying loan by sale or securitization.
Outstanding derivative loan commitments expose us to
the risk that the price of the loans underlying the commit-
ments might decline due to increases in mortgage interest
rates from inception of the rate lock to the funding of the
loan. To minimize this risk, we utilize Treasury futures, for-
wards and options, Eurodollar futures and forward contracts
as economic hedges against the potential decreases in the
values of the loans that could result from the exercise of the
loan commitments. We expect that these derivative financial
instruments will experience changes in fair value that will
either fully or partially offset the changes in fair value of the
derivative loan commitments.
MARKET RISK – TRADING ACTIVITIES
From a market risk perspective, our net income is exposed
to changes in interest rates, credit spreads, foreign exchange
rates, equity and commodity prices and their implied volatili-
ties. The primary purpose of our trading businesses is to
accommodate customers in the management of their market
price risks. Also, we take positions based on market expecta-
tions or to benefit from price differences between financial
instruments and markets, subject to risk limits established
and monitored by Corporate ALCO. All securities, foreign
exchange transactions, commodity transactions and deriva-
tives—transacted with customers or used to hedge capital
market transactions with customers—are carried at fair
value. The Institutional Risk Committee establishes and
monitors counterparty risk limits. The notional or contractual
amount, credit risk amount and estimated net fair value
of all customer accommodation derivatives at December 31,
2006 and 2005, are included in Note 26 (Derivatives) to
Financial Statements. Open, “at risk” positions for all trading
business are monitored by Corporate ALCO.
The standardized approach for monitoring and reporting
market risk for the trading activities is the value-at-risk (VAR)
metrics complemented with factor analysis and stress testing.
VAR measures the worst expected loss over a given time
interval and within a given confidence interval. We measure
and report daily VAR at 99% confidence interval based on
actual changes in rates and prices over the past 250 days.
The analysis captures all financial instruments that are
considered trading positions. The average one-day VAR
throughout 2006 was $15 million, with a lower bound of
$10 million and an upper bound of $35 million.
MARKET RISK – EQUITY MARKETS
We are directly and indirectly affected by changes in the
equity markets. We make and manage direct equity invest-
ments in start-up businesses, emerging growth companies,
management buy-outs, acquisitions and corporate recapital-
izations. We also invest in non-affiliated funds that make
similar private equity investments. These private equity
investments are made within capital allocations approved by
management and the Board of Directors (the Board). The
Board reviews business developments, key risks and historical
returns for the private equity investments at least annually.
Management reviews these investments at least quarterly and
assesses them for possible other-than-temporary impairment.
For nonmarketable investments, the analysis is based on facts
and circumstances of each investment and the expectations for
that investment’s cash flows and capital needs, the viability
of its business model and our exit strategy. Private equity
investments totaled $1.67 billion at December 31, 2006,
and $1.54 billion at December 31, 2005.
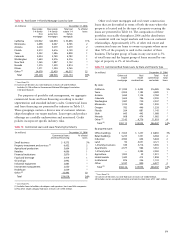
We also have marketable equity securities in the available
for sale investment portfolio, including securities relating to
our venture capital activities. We manage these investments
within capital risk limits approved by management and the
Board and monitored by Corporate ALCO. Gains and losses
on these securities are recognized in net income when realized
and other-than-temporary impairment may be periodically
recorded when identified. The initial indicator of impairment
for marketable equity securities is a sustained decline in
market price below the amount recorded for that investment.
We consider a variety of factors, such as: the length of time
and the extent to which the market value has been less than
cost; the issuer’s financial condition, capital strength, and
near-term prospects; any recent events specific to that issuer
and economic conditions of its industry; and our investment
horizon in relationship to an anticipated near-term recovery
in the stock price, if any. The fair value of marketable equity
securities was $796 million and cost was $592 million at
December 31, 2006, and $900 million and $558 million,
respectively, at December 31, 2005.
Changes in equity market prices may also indirectly affect
our net income (1) by affecting the value of third party assets
under management and, hence, fee income, (2) by affecting
particular borrowers, whose ability to repay principal and/or
interest may be affected by the stock market, or (3) by affecting
brokerage activity, related commission income and other
business activities. Each business line monitors and manages
these indirect risks.
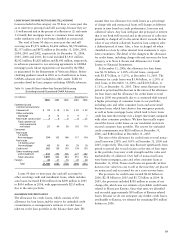
LIQUIDITY AND FUNDING
The objective of effective liquidity management is to ensure
that we can meet customer loan requests, customer deposit
maturities/withdrawals and other cash commitments effi-
ciently under both normal operating conditions and under
unpredictable circumstances of industry or market stress.
To achieve this objective, Corporate ALCO establishes and
monitors liquidity guidelines that require sufficient asset-
based liquidity to cover potential funding requirements and
to avoid over-dependence on volatile, less reliable funding
markets. We set these guidelines for both the consolidated
balance sheet and for the Parent to ensure that the Parent
is a source of strength for its regulated, deposit-taking
banking subsidiaries.
Debt securities in the securities available for sale portfolio
provide asset liquidity, in addition to the immediately liquid
resources of cash and due from banks and federal funds
sold, securities purchased under resale agreements and other
short-term investments. The weighted-average expected