Wells Fargo 2006 Annual Report Download - page 100
Download and view the complete annual report
Please find page 100 of the 2006 Wells Fargo annual report below. You can navigate through the pages in the report by either clicking on the pages listed below, or by using the keyword search tool below to find specific information within the annual report.-
 1
1 -
2
-
3
-
4
-
5
-
6
-
7
-
8
-
9
-
10
-
11
-
12
-
13
-
14
-
15
-
16
-
17
-
18
-
19
-
20
-
21
-
22
-
23
-
24
-
25
-
26
-
27
-
28
-
29
-
30
-
31
-
32
-
33
-
34
-
35
-
36
-
37
-
38
-
39
-
40
-
41
-
42
-
43
-
44
-
45
-
46
-
47
-
48
-
49
-
50
-
51
-
52
-
53
-
54
-
55
-
56
-
57
-
58
-
59
-
60
-
61
-
62
-
63
-
64
-
65
-
66
-
67
-
68
-
69
-
70
-
71
-
72
-
73
-
74
-
75
-
76
-
77
-
78
-
79
-
80
-
81
-
82
-
83
-
84
-
85
-
86
-
87
-
88
-
89
-
 90
90 -
 91
91 -
 92
92 -
 93
93 -
 94
94 -
 95
95 -
 96
96 -
 97
97 -
 98
98 -
 99
99 -
 100
100 -
 101
101 -
 102
102 -
 103
103 -
 104
104 -
 105
105 -
 106
106 -
 107
107 -
 108
108 -
 109
109 -
 110
110 -
111
-
112
-
113
-
114
-
115
-
116
-
117
-
118
-
119
-
120
-
121
-
122
-
123
-
124
-
125
-
126
-
127
-
128
 |
 |

98
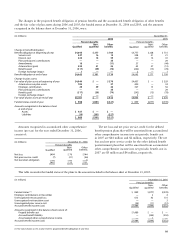
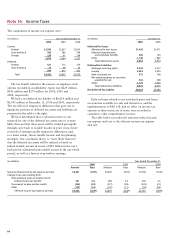
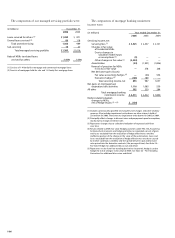
(in millions) December 31,
2006 2005
Deferred Tax Assets
Allowance for loan losses $1,430 $1,471
Deferred compensation
and employee benefits 484 156
Other 1,140 807
Total deferred tax assets 3,054 2,434
Deferred Tax Liabilities
Mortgage servicing rights 4,234 3,517
Leasing 2,349 2,430
Mark to market, net 972 708
Net unrealized gains on securities
available for sale 342 368
Other 1,175 1,006
Total deferred tax liabilities 9,072 8,029
Net Deferred Tax Liability $6,018 $5,595
The components of income tax expense were:
The tax benefit related to the exercise of employee stock
options recorded in stockholders’ equity was $229 million,
$143 million and $175 million for 2006, 2005 and
2004, respectively.
We had a net deferred tax liability of $6,018 million and
$5,595 million at December 31, 2006 and 2005, respectively.
The tax effects of temporary differences that gave rise to
significant portions of deferred tax assets and liabilities are
presented in the table to the right.
We have determined that a valuation reserve is not
required for any of the deferred tax assets since it is more
likely than not that these assets will be realized principally
through carry back to taxable income in prior years, future
reversals of existing taxable temporary differences, and,
to a lesser extent, future taxable income and tax planning
strategies. Our conclusion that it is “more likely than not”
that the deferred tax assets will be realized is based on
federal taxable income in excess of $19 billion in the carry-
back period, substantial state taxable income in the carry-back
period, as well as a history of growth in earnings.
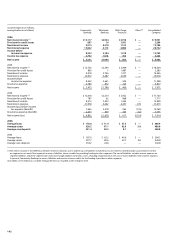
Note 16: Income Taxes
(in millions) Year ended December 31,
2006 2005 2004
Current:
Federal $2,993 $2,627 $2,815
State and local 438 346 354
Foreign 239 91 154
3,670 3,064 3,323
Deferred:
Federal 521 715 379
State and local 72 98 53
593 813 432
Total $4,263 $3,877 $3,755
Deferred taxes related to net unrealized gains and losses
on securities available for sale and derivatives, and the
implementation of FAS 158, had no effect on income tax
expense as these items, net of taxes, were recorded in
cumulative other comprehensive income.
The table below reconciles the statutory federal income
tax expense and rate to the effective income tax expense
and rate.
(in millions) Year ended December 31,
2006 2005 2004
Amount Rate Amount Rate Amount Rate
Statutory federal income tax expense and rate $4,461 35.0% $4,042 35.0% $3,769 35.0%
Change in tax rate resulting from:
State and local taxes on income, net of
federal income tax benefit 331 2.6 289 2.5 265 2.5
Tax-exempt income and tax credits (356) (2.8) (327) (2.8) (224) (2.1)
Other (173)(1.4)(127) (1.1)(55)(0.5)
Effective income tax expense and rate $4,263 33.4% $3,877 33.6% $3,755 34.9%