Wells Fargo 2006 Annual Report Download - page 125
Download and view the complete annual report
Please find page 125 of the 2006 Wells Fargo annual report below. You can navigate through the pages in the report by either clicking on the pages listed below, or by using the keyword search tool below to find specific information within the annual report.-
 1
1 -
2
-
3
-
4
-
5
-
6
-
7
-
8
-
9
-
10
-
11
-
12
-
13
-
14
-
15
-
16
-
17
-
18
-
19
-
20
-
21
-
22
-
23
-
24
-
25
-
26
-
27
-
28
-
29
-
30
-
31
-
32
-
33
-
34
-
35
-
36
-
37
-
38
-
39
-
40
-
41
-
42
-
43
-
44
-
45
-
46
-
47
-
48
-
49
-
50
-
51
-
52
-
53
-
54
-
55
-
56
-
57
-
58
-
59
-
60
-
61
-
62
-
63
-
64
-
65
-
66
-
67
-
68
-
69
-
70
-
71
-
72
-
73
-
74
-
75
-
76
-
77
-
78
-
79
-
80
-
81
-
82
-
83
-
84
-
85
-
86
-
87
-
88
-
89
-
90
-
91
-
92
-
93
-
94
-
95
-
96
-
97
-
98
-
99
-
100
-
101
-
102
-
103
-
104
-
105
-
106
-
107
-
108
-
109
-
110
-
111
-
112
-
113
-
114
-
 115
115 -
 116
116 -
 117
117 -
 118
118 -
 119
119 -
 120
120 -
 121
121 -
 122
122 -
 123
123 -
 124
124 -
 125
125 -
 126
126 -
 127
127 -
 128
128
 |
 |
123
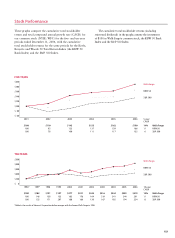
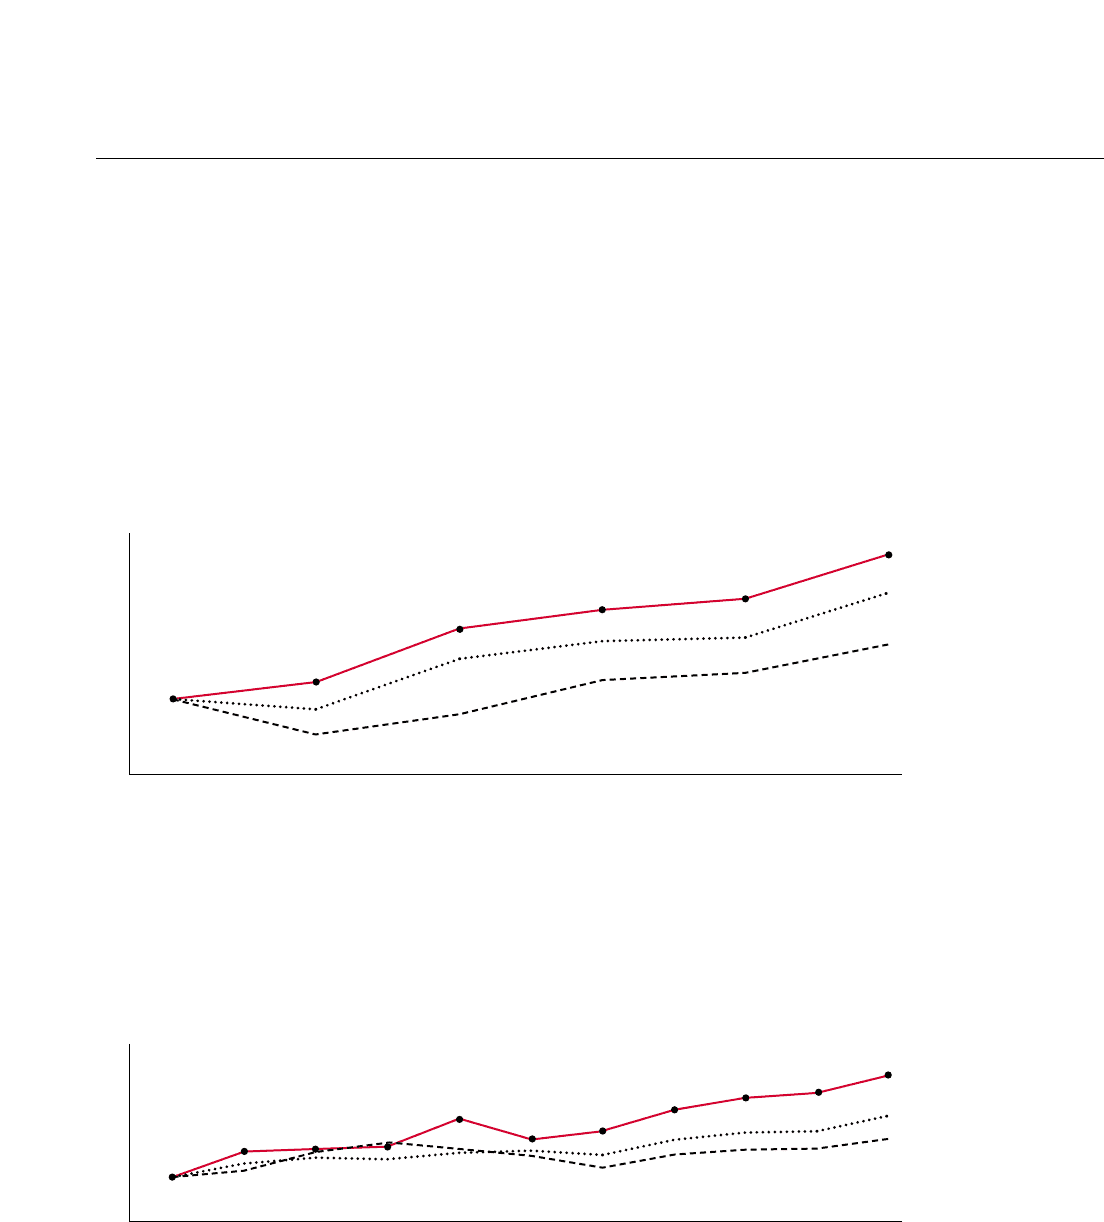
Stock Performance
These graphs compare the cumulative total stockholder
return and total compound annual growth rate (CAGR) for
our common stock (NYSE: WFC) for the five- and ten-year
periods ended December 31, 2006, with the cumulative
total stockholder returns for the same periods for the Keefe,
Bruyette and Woods 50 Total Return Index (the KBW 50
Bank Index) and the S&P 500 Index.
The cumulative total stockholder returns (including
reinvested dividends) in the graphs assume the investment
of $100 in Wells Fargo’s common stock, the KBW 50 Bank
Index and the S&P 500 Index.
$200
$180
$160
$140
$120
$100
$80
$60
2001
$100
100
100
2002
$110
93
78
2003
$143
125
100
2004
$155
137
111
2005
$162
139
117
2006
$190
166
135
$500
$400
$300
$200
$100
$0
1996*
$100
100
100
1997*
$182
146
133
1998
$191
158
171
1999
$197
153
207
2000
$277
183
188
2001
$221
176
166
2002
$244
164
130
2003
$316
219
167
2004
$344
241
185
2005
$359
244
194
2006
$419
291
224
Wells Fargo
KBW 50
S&P 500
5-year
CAGR
14% Wells Fargo
11 KBW 50
6 S&P 500
FIVE YEARS
TEN YEARS
10-year
CAGR
15% Wells Fargo
11 KBW 50
8 S&P 500
Wells Fargo
KBW 50
S&P 500
*Reflects the results of Norwest Corporation before merger with the former Wells Fargo in 1998.