Wells Fargo 2006 Annual Report Download - page 101
Download and view the complete annual report
Please find page 101 of the 2006 Wells Fargo annual report below. You can navigate through the pages in the report by either clicking on the pages listed below, or by using the keyword search tool below to find specific information within the annual report.-
 1
1 -
2
-
3
-
4
-
5
-
6
-
7
-
8
-
9
-
10
-
11
-
12
-
13
-
14
-
15
-
16
-
17
-
18
-
19
-
20
-
21
-
22
-
23
-
24
-
25
-
26
-
27
-
28
-
29
-
30
-
31
-
32
-
33
-
34
-
35
-
36
-
37
-
38
-
39
-
40
-
41
-
42
-
43
-
44
-
45
-
46
-
47
-
48
-
49
-
50
-
51
-
52
-
53
-
54
-
55
-
56
-
57
-
58
-
59
-
60
-
61
-
62
-
63
-
64
-
65
-
66
-
67
-
68
-
69
-
70
-
71
-
72
-
73
-
74
-
75
-
76
-
77
-
78
-
79
-
80
-
81
-
82
-
83
-
84
-
85
-
86
-
87
-
88
-
89
-
90
-
 91
91 -
 92
92 -
 93
93 -
 94
94 -
 95
95 -
 96
96 -
 97
97 -
 98
98 -
 99
99 -
 100
100 -
 101
101 -
 102
102 -
 103
103 -
 104
104 -
 105
105 -
 106
106 -
 107
107 -
 108
108 -
 109
109 -
 110
110 -
 111
111 -
112
-
113
-
114
-
115
-
116
-
117
-
118
-
119
-
120
-
121
-
122
-
123
-
124
-
125
-
126
-
127
-
128
 |
 |

99
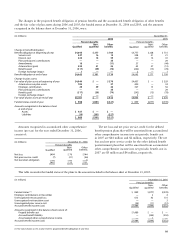
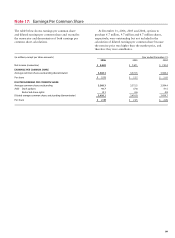
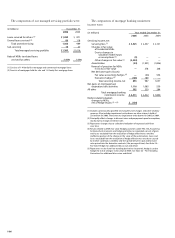
(in millions, except per share amounts) Year ended December 31,
2006 2005 2004
Net income (numerator) $ 8,482 $ 7,671 $ 7,014
EARNINGS PER COMMON SHARE
Average common shares outstanding (denominator) 3,368.3 3,372.5 3,384.4
Per share $2.52 $ 2.27 $ 2.07
DILUTED EARNINGS PER COMMON SHARE
Average common shares outstanding 3,368.3 3,372.5 3,384.4
Add: Stock options 41.7 37.8 41.5
Restricted share rights 0.1 0.6 0.8
Diluted average common shares outstanding (denominator) 3,410.1 3,410.9 3,426.7
Per share $2.49 $ 2.25 $ 2.05
The table below shows earnings per common share
and diluted earnings per common share and reconciles
the numerator and denominator of both earnings per
common share calculations.
Note 17: Earnings Per Common Share
At December 31, 2006, 2005 and 2004, options to
purchase 6.7 million, 9.7 million and 6.7 million shares,
respectively, were outstanding but not included in the
calculation of diluted earnings per common share because
the exercise price was higher than the market price, and
therefore they were antidilutive.