Wells Fargo 2006 Annual Report Download - page 36
Download and view the complete annual report
Please find page 36 of the 2006 Wells Fargo annual report below. You can navigate through the pages in the report by either clicking on the pages listed below, or by using the keyword search tool below to find specific information within the annual report.-
 1
1 -
2
-
3
-
4
-
5
-
6
-
7
-
8
-
9
-
10
-
11
-
12
-
13
-
14
-
15
-
16
-
17
-
18
-
19
-
20
-
21
-
22
-
23
-
24
-
25
-
 26
26 -
 27
27 -
 28
28 -
 29
29 -
 30
30 -
 31
31 -
 32
32 -
 33
33 -
 34
34 -
 35
35 -
 36
36 -
 37
37 -
 38
38 -
 39
39 -
 40
40 -
 41
41 -
 42
42 -
 43
43 -
 44
44 -
 45
45 -
 46
46 -
47
-
48
-
49
-
50
-
51
-
52
-
53
-
54
-
55
-
56
-
57
-
58
-
59
-
60
-
61
-
62
-
63
-
64
-
65
-
66
-
67
-
68
-
69
-
70
-
71
-
72
-
73
-
74
-
75
-
76
-
77
-
78
-
79
-
80
-
81
-
82
-
83
-
84
-
85
-
86
-
87
-
88
-
89
-
90
-
91
-
92
-
93
-
94
-
95
-
96
-
97
-
98
-
99
-
100
-
101
-
102
-
103
-
104
-
105
-
106
-
107
-
108
-
109
-
110
-
111
-
112
-
113
-
114
-
115
-
116
-
117
-
118
-
119
-
120
-
121
-
122
-
123
-
124
-
125
-
126
-
127
-
128
 |
 |
34
Wells Fargo & Company is a $482 billion diversified financial
services company providing banking, insurance, investments,
mortgage banking and consumer finance through banking stores,
the internet and other distribution channels to consumers,
businesses and institutions in all 50 states of the U.S. and in
other countries. We ranked fifth in assets and fourth in market
value of our common stock among U.S. bank holding companies
at December 31, 2006. When we refer to “the Company,”
“we,” “our” or “us” in this Report, we mean Wells Fargo &
Company and Subsidiaries (consolidated). When we refer to
“the Parent,” we mean Wells Fargo & Company.
We had another exceptional year in 2006, with record
diluted earnings per share of $2.49, record net income of
$8.5 billion, both up 11%, and exceptional, broad-based
performance across our more than 80 businesses. All com-
mon share and per share disclosures in this Report reflect the
two-for-one stock split in the form of a 100% stock dividend
distributed August 11, 2006.
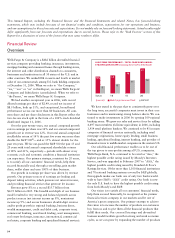
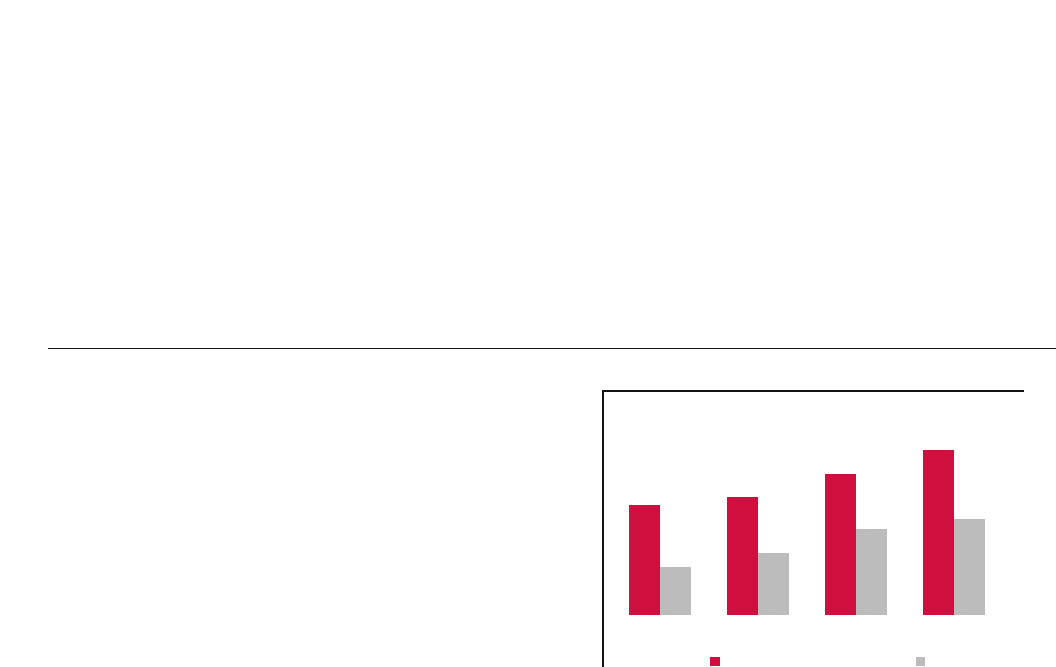
Over the past twenty years, our annual compound growth
rate in earnings per share was 14% and our annual compound
growth rate in revenue was 12%. Our total annual compound
stockholder return of 14% the past five years was more than
double the S&P 500®—and at 15% almost double for the
past ten years. We far out-paced the S&P 500 the past 15 and
20 years with total annual compound shareholder returns
of 18% and 21%, respectively—periods with almost every
economic cycle and economic condition a financial institution
can experience. Our primary strategy, consistent for 20 years,
is to satisfy all our customers’ financial needs, help them
succeed financially and, through cross-selling, gain market
share, wallet share and earn 100% of their business.
Our growth in earnings per share was driven by revenue
growth. Our primary sources of earnings are lending and
deposit taking activities, which generate net interest income,
and providing financial services that generate fee income.
Revenue grew 8% to a record $35.7 billion from
$32.9 billion in 2005. The breadth and depth of our business
model resulted in very strong and balanced growth across
product sources (net interest income up 8%, noninterest
income up 9%) and across businesses (double-digit revenue
and/or profit growth in regional banking, business direct,
wealth management, credit and debit card, corporate trust,
commercial banking, asset-based lending, asset management,
real estate brokerage, insurance, international, commercial
real estate, corporate banking and specialized financial services).
We have stated in the past that to consistently grow over
the long term, successful companies must invest in their core
businesses and in maintaining strong balance sheets. We con-
tinued to make investments in 2006 by opening 109 regional
banking stores. We grew our sales and service force by adding
4,497 team members (full-time equivalents) in 2006, including
1,914 retail platform bankers. We continued to be #1 in many
categories of financial services nationally, including retail
mortgage originations, home equity lending, small business
lending, agricultural lending, internet banking, and provider of
financial services to middle-market companies in the western U.S.
Our solid financial performance enables us to be one of
the top givers to non-profits among all U.S. companies.
Wells Fargo Bank, N.A. continued to be rated as “Aaa,” the
highest possible credit rating issued by Moody’s Investors
Service, and was upgraded in February 2007 to “AAA,” the
highest possible credit rating issued by Standard & Poor’s
Ratings Services. Of the more than 1,100 financial institutions
and 70 national banking systems covered by S&P globally,
this upgrade makes our bank one of only two banks world-
wide to have S&P’s “AAA” credit rating. Our bank is now
the only U.S. bank to have the highest possible credit rating
from both Moody’s and S&P.
Our vision is to satisfy all our customers’ financial needs,
help them succeed financially, be recognized as the premier
financial services company in our markets and be one of
America’s great companies. Our primary strategy to achieve
this vision is to increase the number of products our customers
buy from us and to give them all the financial products that
fulfill their needs. Our cross-sell strategy and diversified
business model facilitate growth in strong and weak economic
cycles, as we can grow by expanding the number of products
Overview
This Annual Report, including the Financial Review and the Financial Statements and related Notes, has forward-looking
statements, which may include forecasts of our financial results and condition, expectations for our operations and business,
and our assumptions for those forecasts and expectations. Do not unduly rely on forward-looking statements. Actual results might
differ significantly from our forecasts and expectations due to several factors. Please refer to the “Risk Factors” section of this
Report for a discussion of some of the factors that may cause results to differ.
14%
6
15
12
18
11
10 15 20
5 years
(percent) Wells Fargo Common Stock S&P 500
LONG-TERM PERFORMANCE – TOTAL COMPOUND ANNUAL
STOCKHOLDER RETURN (Including reinvestment of dividends)
21
8
Financial Review