Wells Fargo 2006 Annual Report Download - page 46
Download and view the complete annual report
Please find page 46 of the 2006 Wells Fargo annual report below. You can navigate through the pages in the report by either clicking on the pages listed below, or by using the keyword search tool below to find specific information within the annual report.-
 1
1 -
2
-
3
-
4
-
5
-
6
-
7
-
8
-
9
-
10
-
11
-
12
-
13
-
14
-
15
-
16
-
17
-
18
-
19
-
20
-
21
-
22
-
23
-
24
-
25
-
26
-
27
-
28
-
29
-
30
-
31
-
32
-
33
-
34
-
35
-
 36
36 -
 37
37 -
 38
38 -
 39
39 -
 40
40 -
 41
41 -
 42
42 -
 43
43 -
 44
44 -
 45
45 -
 46
46 -
 47
47 -
 48
48 -
 49
49 -
 50
50 -
 51
51 -
 52
52 -
 53
53 -
 54
54 -
 55
55 -
 56
56 -
57
-
58
-
59
-
60
-
61
-
62
-
63
-
64
-
65
-
66
-
67
-
68
-
69
-
70
-
71
-
72
-
73
-
74
-
75
-
76
-
77
-
78
-
79
-
80
-
81
-
82
-
83
-
84
-
85
-
86
-
87
-
88
-
89
-
90
-
91
-
92
-
93
-
94
-
95
-
96
-
97
-
98
-
99
-
100
-
101
-
102
-
103
-
104
-
105
-
106
-
107
-
108
-
109
-
110
-
111
-
112
-
113
-
114
-
115
-
116
-
117
-
118
-
119
-
120
-
121
-
122
-
123
-
124
-
125
-
126
-
127
-
128
 |
 |

44
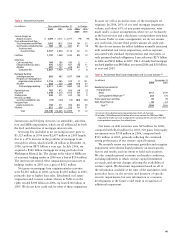
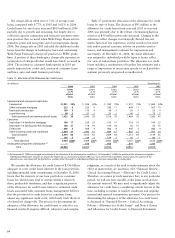
Table 4: Analysis of Changes in Net Interest Income
(in millions) Year ended December 31,
2006 over 2005 2005 over 2004
Volume Rate Total Volume Rate Total
Increase (decrease) in interest income:
Federal funds sold, securities purchased under resale
agreements and other short-term investments $ 2 $ 99 $ 101 $ 22 $ 78 $ 100
Trading assets (17) 72 55 34245
Debt securities available for sale:
Securities of U.S. Treasury and federal agencies (5) 6 1 (6) (2) (8)
Securities of U.S. states and political subdivisions (13) (8) (21) (9) 8 (1)
Mortgage-backed securities:
Federal agencies 1,040 4 1,044 (84) (2) (86)
Private collateralized mortgage obligations 93 54 147 86 17 103
Other debt securities 173 — 173 45 (15) 30
Mortgages held for sale 230 303 533 378 98 476
Loans held for sale (146) 47 (99) (240) 94 (146)
Loans:
Commercial and commercial real estate:
Commercial 529 860 1,389 570 533 1,103
Other real estate mortgage 16 296 312 21 280 301
Real estate construction 278 157 435 142 135 277
Lease financing 12 (10) 2 10 (17) (7)
Consumer:
Real estate 1-4 family first mortgage (1,441) 607 (834) (555) 799 244
Real estate 1-4 family junior lien mortgage 620 827 1,447 658 721 1,379
Credit card 247 108 355 218 49 267
Other revolving credit and installment 730 365 1,095 844 (72) 772
Foreign 205 (55) 150 212 (63) 149
Other (10) 10 — (5) 8 3
Total increase in interest income 2,543 3,742 6,285 2,310 2,691 5,001
Increase (decrease) in interest expense:
Deposits:
Interest-bearing checking 12 60 72 33538
Market rate and other savings 75 1,276 1,351 52 984 1,036
Savings certificates 337 273 610 96 135 231
Other time deposits 167 530 697 (32) 515 483
Deposits in foreign offices 376 220 596 45 188 233
Short-term borrowings (88) 336 248 (30) 421 391
Long-term debt 186 1,072 1,258 305 924 1,229
Total increase in interest expense 1,065 3,767 4,832 439 3,202 3,641
Increase (decrease) in net interest income
on a taxable-equivalent basis $ 1,478 $ (25) $1,453 $1,871 $ (511) $1,360
Table 4 allocates the changes in net interest income on
a taxable-equivalent basis to changes in either average
balances or average rates for both interest-earning assets
and interest-bearing liabilities. Because of the numerous
simultaneous volume and rate changes during any period,
it is not possible to precisely allocate such changes between
volume and rate. For this table, changes that are not solely
due to either volume or rate are allocated to these categories
in proportion to the percentage changes in average volume
and average rate.
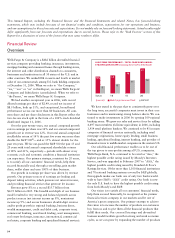
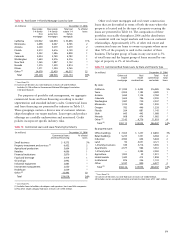
Noninterest Income
We earn trust, investment and IRA fees from managing and
administering assets, including mutual funds, corporate trust,
personal trust, employee benefit trust and agency assets. At
December 31, 2006, these assets totaled $983 billion, up 26%
from $783 billion at December 31, 2005. Generally, trust,
investment and IRA fees are based on the market value of the
assets that are managed, administered, or both. The increase
in these fees in 2006 was due to continued strong growth
across all the trust and investment management businesses.
We also receive commissions and other fees for providing
services to full-service and discount brokerage customers.
At December 31, 2006 and 2005, brokerage assets totaled
$115 billion and $97 billion, respectively. Generally, these fees
include transactional commissions, which are based on the
number of transactions executed at the customer’s direction,
or asset-based fees, which are based on the market value of
the customer’s assets. The increase in these fees in 2006 was
primarily due to continued growth in asset-based fees.
Card fees increased 20% to $1,747 million in 2006 from
$1,458 million in 2005, mostly due to increases in credit
card accounts and credit and debit card transaction volume.
Purchase volume on debit and credit cards was up 21%
from a year ago and average card balances were up 19%.
Mortgage banking noninterest income was $2,311 million
in 2006 compared with $2,422 million in 2005. With the
adoption of FAS 156 in 2006 and measuring our residential
MSRs at fair value, net servicing income includes both changes
in the fair value of MSRs during the period as well as changes
in the value of derivatives (economic hedges) used to hedge
the MSRs. An additional $158 million ($101 million after
tax) increase in the value of MSRs upon remeasurement
to fair value under FAS 156 in 2006 was recorded as an
adjustment to the beginning balance of retained earnings in
stockholders’ equity. Prior to adoption of FAS 156, servicing
income included net derivative gains and losses (primarily the
ineffective portion of the change in value of derivatives used
to hedge MSRs under FAS 133, Accounting for Derivative