Wells Fargo 2006 Annual Report Download - page 37
Download and view the complete annual report
Please find page 37 of the 2006 Wells Fargo annual report below. You can navigate through the pages in the report by either clicking on the pages listed below, or by using the keyword search tool below to find specific information within the annual report.-
 1
1 -
2
-
3
-
4
-
5
-
6
-
7
-
8
-
9
-
10
-
11
-
12
-
13
-
14
-
15
-
16
-
17
-
18
-
19
-
20
-
21
-
22
-
23
-
24
-
25
-
26
-
 27
27 -
 28
28 -
 29
29 -
 30
30 -
 31
31 -
 32
32 -
 33
33 -
 34
34 -
 35
35 -
 36
36 -
 37
37 -
 38
38 -
 39
39 -
 40
40 -
 41
41 -
 42
42 -
 43
43 -
 44
44 -
 45
45 -
 46
46 -
 47
47 -
48
-
49
-
50
-
51
-
52
-
53
-
54
-
55
-
56
-
57
-
58
-
59
-
60
-
61
-
62
-
63
-
64
-
65
-
66
-
67
-
68
-
69
-
70
-
71
-
72
-
73
-
74
-
75
-
76
-
77
-
78
-
79
-
80
-
81
-
82
-
83
-
84
-
85
-
86
-
87
-
88
-
89
-
90
-
91
-
92
-
93
-
94
-
95
-
96
-
97
-
98
-
99
-
100
-
101
-
102
-
103
-
104
-
105
-
106
-
107
-
108
-
109
-
110
-
111
-
112
-
113
-
114
-
115
-
116
-
117
-
118
-
119
-
120
-
121
-
122
-
123
-
124
-
125
-
126
-
127
-
128
 |
 |

35
our current customers have with us. Our cross-sell set records
for the eighth consecutive year—our average retail banking
household now has 5.2 products, almost one in five have more
than eight, six for Wholesale Banking customers, and our
average middle-market commercial banking customer has more
than seven products. Our goal is eight products per customer,
which is currently half of our estimate of potential demand.
Our core products grew this year:
• Average loans grew by 4% (up 14% excluding
real estate 1-4 family first mortgages);
• Average core deposits grew by 7%; and
• Assets managed and administered were up 26%.
We believe it is important to maintain a well-controlled
environment as we continue to grow our businesses. We manage
our credit risk by setting credit policies for underwriting,
and monitoring and reviewing the performance of our loan
portfolio. We maintain a well-diversified loan portfolio,
measured by industry, geography and product type. We
manage the interest rate and market risks inherent in our asset
and liability balances within prudent ranges, while ensuring
adequate liquidity and funding. Our stockholder value has
increased over time due to customer satisfaction, strong financial
results, investment in our businesses, consistent execution of
our business model and management of our business risks.
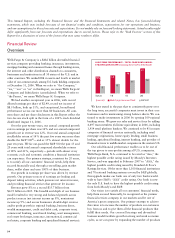
Our financial results included the following:
Net income in 2006 increased 11% to $8.5 billion from
$7.7 billion in 2005. Diluted earnings per common share
increased 11% to $2.49 in 2006 from $2.25 in 2005. Return
on average total assets was 1.75% and return on average
stockholders’ equity was 19.65% in 2006, compared with
1.72% and 19.59%, respectively, in 2005.
Net interest income on a taxable-equivalent basis was
$20.1 billion in 2006, compared with $18.6 billion a year
ago, reflecting solid loan growth (excluding adjustable rate
mortgages (ARMs)) and a relatively stable net interest margin.
With short-term interest rates now above 5%, our cumulative
sales of ARMs and debt securities since mid-2004 have had
a positive impact on our net interest margin and net interest
income. We have completed our sales of over $90 billion of
ARMs since mid-2004 with the sales of $26 billion of ARMs
in second quarter 2006. Average earning assets grew 8% from
2005, or 17% excluding 1-4 family first mortgages (the loan
category that includes ARMs). Our net interest margin was
4.83% for 2006, compared with 4.86% in 2005.
Noninterest income increased 9% to $15.7 billion in
2006 from $14.4 billion in 2005. Growth in noninterest
income was driven by growth across our businesses, with
particular strength in trust and investment fees (up 12%),
card fees (up 20%), insurance fees (up 10%) and gains on
equity investments (up 44%).
Revenue, the sum of net interest income and noninterest
income, increased 8% to a record $35.7 billion in 2006 from
$32.9 billion in 2005. Wells Fargo Home Mortgage (Home
Mortgage) revenue decreased $704 million, or 15%, to
$4.2 billion in 2006 from $4.9 billion in 2005. Combined
revenue in businesses other than Home Mortgage grew 12%
from 2005 to 2006, with double-digit revenue growth in
virtually every major business line other than Home Mortgage.
Noninterest expense was $20.7 billion in 2006, up
9% from $19.0 billion in 2005, primarily due to continued
investments in new stores and additional sales and service-
related team members. We began expensing stock options
on January 1, 2006. Total stock option expense reduced
earnings by approximately $0.025 per share for 2006.
During 2006, net charge-offs were $2.25 billion, or
0.73% of average total loans, compared with $2.28 billion,
or 0.77%, during 2005. Credit losses for auto loans increased
$160 million in 2006 partially due to growth and seasoning,
but largely due to collection capacity constraints and restrictive
payment extension practices that occurred when Wells Fargo
Financial integrated its prime and non-prime auto loan
businesses during 2006. Credit losses for 2005 included
$171 million of incremental fourth quarter bankruptcy losses
and increased losses of $163 million in first quarter 2005 to
conform Wells Fargo Financial’s charge-off practices to more
stringent Federal Financial Institutions Examination Council
(FFIEC) guidelines. The provision for credit losses was
$2.20 billion in 2006, down $179 million from $2.38 billion
in 2005. The 2005 provision for credit losses also included
$100 million for estimated credit losses related to Hurricane
Katrina. We subsequently realized approximately $50 million
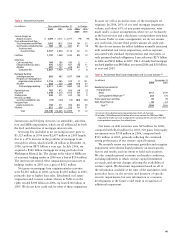
Table 1: Ratios and Per Common Share Data
Year ended December 31 ,
2006 2005 2004
PROFITABILITY RATIOS
Net income to average total assets (ROA) 1.75% 1.72%
1.71%
Net income to average stockholders’ equity (ROE) 19.65
19.59 19.57
EFFICIENCY RATIO
(1)
58.1
57.7 58.5
CAPITAL RATIOS
At year end:
Stockholders’ equity to assets 9.52
8.44 8.85
Risk-based capital
(2)
Tier 1 capital 8.95
8.26 8.41
Total capital 12.50
11.64 12.07
Tier 1 leverage
(2)
7.89
6.99 7.08
Average balances:
Stockholders’ equity to assets 8.88
8.78 8.73
PER COMMON SHARE DATA
Dividend payout
(3)
42.9
44.1 44.9
Book value $13.58
$12.12 $11.17
Market price
(4)
High $36.99
$32.35 $32.02
Low 30.31
28.81 27.16
Year end 35.56
31.42 31.08
(1) The efficiency ratio is noninterest expense divided by total revenue (net
interest income and noninterest income).
(2) See Note 25 (Regulatory and Agency Capital Requirements) to Financial
Statements for additional information.
(3) Dividends declared per common share as a percentage of earnings per
common share.
(4) Based on daily prices reported on the New York Stock Exchange Composite
Transaction Reporting System.