Wells Fargo 2006 Annual Report Download - page 55
Download and view the complete annual report
Please find page 55 of the 2006 Wells Fargo annual report below. You can navigate through the pages in the report by either clicking on the pages listed below, or by using the keyword search tool below to find specific information within the annual report.-
 1
1 -
2
-
3
-
4
-
5
-
6
-
7
-
8
-
9
-
10
-
11
-
12
-
13
-
14
-
15
-
16
-
17
-
18
-
19
-
20
-
21
-
22
-
23
-
24
-
25
-
26
-
27
-
28
-
29
-
30
-
31
-
32
-
33
-
34
-
35
-
36
-
37
-
38
-
39
-
40
-
41
-
42
-
43
-
44
-
 45
45 -
 46
46 -
 47
47 -
 48
48 -
 49
49 -
 50
50 -
 51
51 -
 52
52 -
 53
53 -
 54
54 -
 55
55 -
 56
56 -
 57
57 -
 58
58 -
 59
59 -
 60
60 -
 61
61 -
 62
62 -
 63
63 -
 64
64 -
 65
65 -
66
-
67
-
68
-
69
-
70
-
71
-
72
-
73
-
74
-
75
-
76
-
77
-
78
-
79
-
80
-
81
-
82
-
83
-
84
-
85
-
86
-
87
-
88
-
89
-
90
-
91
-
92
-
93
-
94
-
95
-
96
-
97
-
98
-
99
-
100
-
101
-
102
-
103
-
104
-
105
-
106
-
107
-
108
-
109
-
110
-
111
-
112
-
113
-
114
-
115
-
116
-
117
-
118
-
119
-
120
-
121
-
122
-
123
-
124
-
125
-
126
-
127
-
128
 |
 |

53
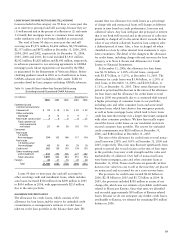
LOANS 90 DAYS OR MORE PAST DUE AND STILL ACCRUING
Loans included in this category are 90 days or more past due
as to interest or principal and still accruing, because they are
(1) well-secured and in the process of collection or (2) real estate
1-4 family first mortgage loans or consumer loans exempt
under regulatory rules from being classified as nonaccrual.
The total of loans 90 days or more past due and still
accruing was $5,073 million, $3,606 million, $2,578 million,
$2,337 million and $672 million at December 31, 2006, 2005,
2004, 2003 and 2002, respectively. At December 31, 2006,
2005, 2004 and 2003, the total included $3,913 million,
$2,923 million, $1,820 million and $1,641 million, respectively,
in advances pursuant to our servicing agreements to GNMA
mortgage pools whose repayments are insured by the FHA
or guaranteed by the Department of Veterans Affairs. Before
clarifying guidance issued in 2003 as to classification as loans,
GNMA advances were included in other assets. Table 16
provides detail by loan category excluding GNMA advances.
Loans 90 days or more past due and still accruing for
other revolving credit and installment loans, which includes
auto loans, increased $326 million from $290 million in 2005
to $616 million in 2006, with approximately $235 million
due to the auto portfolio.
ALLOWANCE FOR CREDIT LOSSES
The allowance for credit losses, which consists of the
allowance for loan losses and the reserve for unfunded credit
commitments, is management’s estimate of credit losses
inherent in the loan portfolio at the balance sheet date. We
assume that our allowance for credit losses as a percentage
of charge-offs and nonaccrual loans will change at different
points in time based on credit performance, loan mix and
collateral values. Any loan with past due principal or interest
that is not both well-secured and in the process of collection
generally is charged off (to the extent that it exceeds the fair
value of any related collateral) based on loan category after
a defined period of time. Also, a loan is charged off when
classified as a loss by either internal loan examiners or regu-
latory examiners. The detail of the changes in the allowance
for credit losses, including charge-offs and recoveries by loan
category, is in Note 6 (Loans and Allowance for Credit
Losses) to Financial Statements.
At December 31, 2006, the allowance for loan losses
was $3.76 billion, or 1.18% of total loans, compared
with $3.87 billion, or 1.25%, at December 31, 2005. The
allowance for credit losses was $3.96 billion, or 1.24% of
total loans, at December 31, 2006, and $4.06 billion, or
1.31%, at December 31, 2005. These ratios fluctuate from
period to period and the decrease in the ratios of the allowance
for loan losses and the allowance for credit losses to total
loans in 2006 was primarily due to a continued shift toward
a higher percentage of consumer loans in our portfolio,
including auto and other consumer loans and some small
business loans, which have shorter loss emergence periods,
as well as home mortgage loans, which tend to have lower
credit loss rates that emerge over a longer time frame compared
with other consumer products. We have historically experi-
enced the lowest credit losses on our residential real estate
secured consumer loan portfolio. The reserve for unfunded
credit commitments was $200 million at December 31,
2006, and $186 million at December 31, 2005.
The ratio of the allowance for credit losses to total nonac-
crual loans was 238% and 303% at December 31, 2006 and
2005, respectively. This ratio may fluctuate significantly from
period to period due to such factors as the mix of loan types
in the portfolio, borrower credit strength and the value and
marketability of collateral. Over half of nonaccrual loans
were home mortgages, auto and other consumer loans at
December 31, 2006. Nonaccrual loans are generally written
down to fair value less cost to sell at the time they are placed
on nonaccrual and accounted for on a cost recovery basis.
The provision for credit losses totaled $2.20 billion in
2006, $2.38 billion in 2005 and $1.72 billion in 2004. In
2005, the provision included $100 million in excess of net
charge-offs, which was our estimate of probable credit losses
related to Hurricane Katrina. Since that time, we identified
and recorded approximately $50 million of Katrina-related
losses. Because we do not anticipate any further credit losses
attributable to Katrina, we released the remaining $50 million
balance in 2006.
Table 16: Loans 90 Days or More Past Due and Still Accruing
(Excluding Insured/Guaranteed GNMA Advances)
(in millions) December 31,
2006 2005 2004 2003 2002
Commercial and
commercial real estate:
Commercial $15 $ 18 $ 26 $ 87 $ 92
Other real estate
mortgage 313 6 9 7
Real estate construction 3 9 6 611
Total commercial
and commercial
real estate 21 40 38 102 110
Consumer:
Real estate
1-4 family
first mortgage 154 103 148 117 104
Real estate
1-4 family junior
lien mortgage 63 50 40 29 18
Credit card 262 159 150 134 130
Other revolving credit
and installment 616 290 306 271 282
Total consumer 1,095 602 644 551 534
Foreign 44 41 76 43 28
Total $1,160 $683 $758 $696 $672