Wells Fargo 2006 Annual Report Download - page 119
Download and view the complete annual report
Please find page 119 of the 2006 Wells Fargo annual report below. You can navigate through the pages in the report by either clicking on the pages listed below, or by using the keyword search tool below to find specific information within the annual report.-
 1
1 -
2
-
3
-
4
-
5
-
6
-
7
-
8
-
9
-
10
-
11
-
12
-
13
-
14
-
15
-
16
-
17
-
18
-
19
-
20
-
21
-
22
-
23
-
24
-
25
-
26
-
27
-
28
-
29
-
30
-
31
-
32
-
33
-
34
-
35
-
36
-
37
-
38
-
39
-
40
-
41
-
42
-
43
-
44
-
45
-
46
-
47
-
48
-
49
-
50
-
51
-
52
-
53
-
54
-
55
-
56
-
57
-
58
-
59
-
60
-
61
-
62
-
63
-
64
-
65
-
66
-
67
-
68
-
69
-
70
-
71
-
72
-
73
-
74
-
75
-
76
-
77
-
78
-
79
-
80
-
81
-
82
-
83
-
84
-
85
-
86
-
87
-
88
-
89
-
90
-
91
-
92
-
93
-
94
-
95
-
96
-
97
-
98
-
99
-
100
-
101
-
102
-
103
-
104
-
105
-
106
-
107
-
108
-
 109
109 -
 110
110 -
 111
111 -
 112
112 -
 113
113 -
 114
114 -
 115
115 -
 116
116 -
 117
117 -
 118
118 -
 119
119 -
 120
120 -
 121
121 -
 122
122 -
 123
123 -
 124
124 -
 125
125 -
 126
126 -
 127
127 -
 128
128
 |
 |

117117
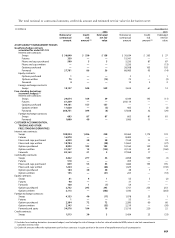
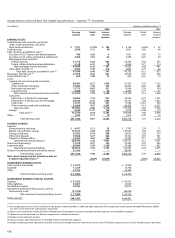
(in millions) December 31,
2006 2005
Notional or Credit Estimated Notional or Credit Estimated
contractual risk net fair contractual risk net fair
amount amount(2) value amount amount(2) value
ASSET/LIABILITY MANAGEMENT HEDGES
Qualifying hedge contracts
accounted for under FAS 133
Interest rate contracts:
Swaps $ 36,840 $ 530 $ 158 $ 30,634 $ 263 $ 37
Futures 339 — — 15,341 — —
Floors and caps purchased 500 5 5 5,250 87 87
Floors and caps written —— — 5,250 — (13)
Options purchased —— — 26,508 103 103
Forwards 27,781 86 36 86,985 95 (14)
Equity contracts:
Options purchased 1— — 311
Options written 75 — (15) 75 — (3)
Forwards 4— — 15 2 2
Foreign exchange contracts:
Swaps 10,157 548 539 3,614 61 12
Free-standing derivatives
(economic hedges)
(1)
Interest rate contracts:
Swaps 29,674 164 39 6,344 145 (11)
Futures 61,339 — — 254,114 — —
Options purchased 94,101 157 157 ———
Options written 11,620 — (5) 405 1 (3)
Forwards 260,751 394 (8) 37,838 32 (29)
Foreign exchange contracts:
Swaps 603 87 87 603 81 81
Forwards 1,000 49 — 1,000 11 —
CUSTOMER ACCOMMODATION,
TRADING AND OTHER
FREE-STANDING DERIVATIVES
Interest rate contracts:
Swaps 100,944 1,286 230 92,462 1,175 133
Futures 16,870 — — 8,400 — —
Floors and caps purchased 6,929 30 30 7,169 33 33
Floors and caps written 10,704 — (20) 12,653 — (27)
Options purchased 8,993 102 102 10,160 129 129
Options written 31,237 15 (133) 41,124 41 (160)
Forwards 83,163 21 5 37,968 17 —
Commodity contracts:
Swaps 3,422 277 34 2,858 599 (1)
Futures 518 — — 455 — —
Floors and caps purchased 839 55 55 1,686 195 195
Floors and caps written 1,224 — (66) 1,629 — (130)
Options purchased 184 30 30 48 7 7
Options written 155 — (31) 203 — (33)
Equity contracts:
Swaps 81 4 1 55 5 (2)
Futures 90 — — 31 — —
Forwards 160 1 (7) 54 — —
Options purchased 2,732 295 295 1,751 253 253
Options written 2,113 — (302) 1,542 — (263)
Foreign exchange contracts:
Swaps 4,133 40 (17) 1,078 35 1
Futures 1— — 53 — —
Options purchased 2,384 72 72 2,280 60 60
Options written 2,145 — (55) 2,219 — (59)
Forwards and spots 34,576 194 19 21,516 220 22
Credit contracts:
Swaps 1,513 30 3 5,454 23 (33)
(1) Includes free-standing derivatives (economic hedges) used to hedge the risk of changes in the fair value of residential MSRs, interest rate lock commitments
and other interests held.
(2) Credit risk amounts reflect the replacement cost for those contracts in a gain position in the event of nonperformance by all counterparties.
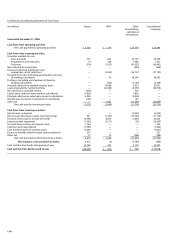
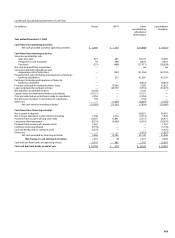
The total notional or contractual amounts, credit risk amount and estimated net fair value for derivatives were: