Wells Fargo 2006 Annual Report Download - page 113
Download and view the complete annual report
Please find page 113 of the 2006 Wells Fargo annual report below. You can navigate through the pages in the report by either clicking on the pages listed below, or by using the keyword search tool below to find specific information within the annual report.-
 1
1 -
2
-
3
-
4
-
5
-
6
-
7
-
8
-
9
-
10
-
11
-
12
-
13
-
14
-
15
-
16
-
17
-
18
-
19
-
20
-
21
-
22
-
23
-
24
-
25
-
26
-
27
-
28
-
29
-
30
-
31
-
32
-
33
-
34
-
35
-
36
-
37
-
38
-
39
-
40
-
41
-
42
-
43
-
44
-
45
-
46
-
47
-
48
-
49
-
50
-
51
-
52
-
53
-
54
-
55
-
56
-
57
-
58
-
59
-
60
-
61
-
62
-
63
-
64
-
65
-
66
-
67
-
68
-
69
-
70
-
71
-
72
-
73
-
74
-
75
-
76
-
77
-
78
-
79
-
80
-
81
-
82
-
83
-
84
-
85
-
86
-
87
-
88
-
89
-
90
-
91
-
92
-
93
-
94
-
95
-
96
-
97
-
98
-
99
-
100
-
101
-
102
-
 103
103 -
 104
104 -
 105
105 -
 106
106 -
 107
107 -
 108
108 -
 109
109 -
 110
110 -
 111
111 -
 112
112 -
 113
113 -
 114
114 -
 115
115 -
 116
116 -
 117
117 -
 118
118 -
 119
119 -
 120
120 -
 121
121 -
 122
122 -
 123
123 -
124
-
125
-
126
-
127
-
128
 |
 |

111111
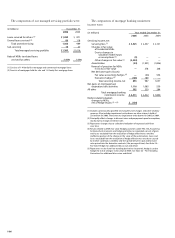
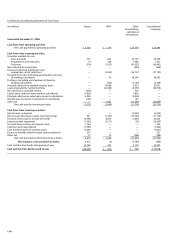
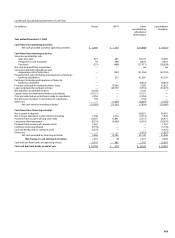
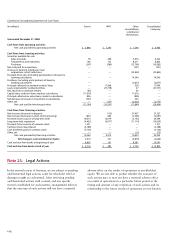
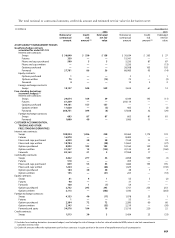
Condensed Consolidating Statement of Cash Flows
(in millions) Parent WFFI Other Consolidated
consolidating Company
subsidiaries/
eliminations
Year ended December 31, 2005
Cash flows from operating activities:
Net cash provided (used) by operating activities $ 5,396 $ 1,159 $(15,888)$ (9,333)
Cash flows from investing activities:
Securities available for sale:
Sales proceeds 631 281 18,147 19,059
Prepayments and maturities 90 248 6,634 6,972
Purchases (231) (486) (27,917) (28,634)
Net cash acquired from acquisitions — — 66 66
Increase in banking subsidiaries’ loan
originations, net of collections — (953) (41,356) (42,309)
Proceeds from sales (including participations) of loans by
banking subsidiaries — 232 42,007 42,239
Purchases (including participations) of loans by
banking subsidiaries — — (8,853) (8,853)
Principal collected on nonbank entities’loans — 19,542 3,280 22,822
Loans originated by nonbank entities — (29,757) (3,918) (33,675)
Net advances to nonbank entities (3,166) — 3,166 —
Capital notes and term loans made to subsidiaries (10,751) — 10,751 —
Principal collected on notes/loans made to subsidiaries 2,950 — (2,950) —
Net decrease (increase) in investment in subsidiaries 194 — (194) —
Other, net — (1,059) (6,697) (7,756)
Net cash used by investing activities (10,283) (11,952) (7,834) (30,069)
Cash flows from financing activities:
Net increase in deposits — — 38,961 38,961
Net increase (decrease) in short-term borrowings 1,048 3,344 (2,514) 1,878
Proceeds from issuance of long-term debt 18,297 11,891 (3,715) 26,473
Long-term debt repayment (8,216) (4,450) (5,910) (18,576)
Proceeds from issuance of common stock 1,367 — — 1,367
Common stock repurchased (3,159) — — (3,159)
Cash dividends paid on common stock (3,375) — — (3,375)
Other, net — — (1,673) (1,673)
Net cash provided by financing activities 5,962 10,785 25,149 41,896
Net change in cash and due from banks 1,075 (8) 1,427 2,494
Cash and due from banks at beginning of year 9,719 482 2,702 12,903
Cash and due from banks at end of year $ 10,794 $ 474 $ 4,129 $ 15,397