Wells Fargo 2006 Annual Report Download - page 108
Download and view the complete annual report
Please find page 108 of the 2006 Wells Fargo annual report below. You can navigate through the pages in the report by either clicking on the pages listed below, or by using the keyword search tool below to find specific information within the annual report.-
 1
1 -
2
-
3
-
4
-
5
-
6
-
7
-
8
-
9
-
10
-
11
-
12
-
13
-
14
-
15
-
16
-
17
-
18
-
19
-
20
-
21
-
22
-
23
-
24
-
25
-
26
-
27
-
28
-
29
-
30
-
31
-
32
-
33
-
34
-
35
-
36
-
37
-
38
-
39
-
40
-
41
-
42
-
43
-
44
-
45
-
46
-
47
-
48
-
49
-
50
-
51
-
52
-
53
-
54
-
55
-
56
-
57
-
58
-
59
-
60
-
61
-
62
-
63
-
64
-
65
-
66
-
67
-
68
-
69
-
70
-
71
-
72
-
73
-
74
-
75
-
76
-
77
-
78
-
79
-
80
-
81
-
82
-
83
-
84
-
85
-
86
-
87
-
88
-
89
-
90
-
91
-
92
-
93
-
94
-
95
-
96
-
97
-
 98
98 -
 99
99 -
 100
100 -
 101
101 -
 102
102 -
 103
103 -
 104
104 -
 105
105 -
 106
106 -
 107
107 -
 108
108 -
 109
109 -
 110
110 -
 111
111 -
 112
112 -
 113
113 -
 114
114 -
 115
115 -
 116
116 -
 117
117 -
 118
118 -
119
-
120
-
121
-
122
-
123
-
124
-
125
-
126
-
127
-
128
 |
 |

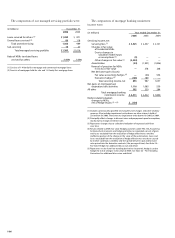
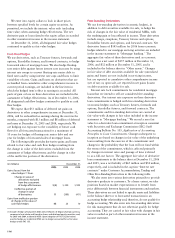
106
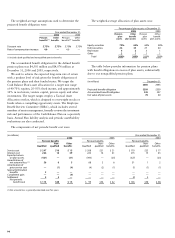
(in billions) December 31,
2006 2005
Loans serviced for others (1) $1,280 $ 871
Owned loans serviced (2) 86 118
Total owned servicing 1,366 989
Sub-servicing 19 27
Total managed servicing portfolio $1,385 $1,016
Ratio of MSRs to related loans
serviced for others 1.41% 1.44%
(1) Consists of 1-4 family first mortgage and commercial mortgage loans.
(2) Consists of mortgages held for sale and 1-4 family first mortgage loans.
The components of our managed servicing portfolio were:
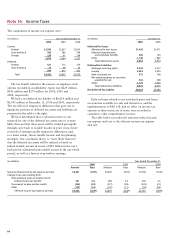
(in millions) Year ended December 31,
2006 2005 2004
Servicing income, net:
Servicing fees (1) $ 3,525 $ 2,457 $ 2,101
Changes in fair value
of residential MSRs:
Due to changes in
valuation model inputs
or assumptions (2) (9) ——
Other changes in fair value (3) (2,444) ——
Amortization (34) (1,991) (1,826)
Reversal of provision for MSRs
in excess of fair value —378 208
Net derivative gains (losses):
Fair value accounting hedges (4) —(46) 554
Economic hedges (5) (145)189 —
Total servicing income, net 893 987 1,037
Net gains on mortgage loan
origination/sales activities 1,116 1,085 539
All other 302 350 284
Total mortgage banking
noninterest income $ 2,311 $ 2,422 $ 1,860
Market-related valuation
changes to MSRs,
net of hedge results (2) + (5) $ (154)
(1) Includes contractually specified servicing fees, late charges and other ancillary
revenues. Also includes impairment write-downs on other interests held of
$26 million for 2006.There were no impairment write-downs for 2005 or 2004.
(2) Principally reflects changes in discount rates and prepayment speed assumptions,
mostly due to changes in interest rates.
(3) Represents changes due to collection/realization of expected cash flows
over time.
(4) Results related to MSRs fair value hedging activities under FAS 133, Accounting
for Derivative Instruments and Hedging Activities (as amended), consist of gains
and losses excluded from the evaluation of hedge effectiveness and the
ineffective portion of the change in the value of these derivatives. Gains and
losses excluded from the evaluation of hedge effectiveness are those caused
by market conditions (volatility) and the spread between spot and forward
rates priced into the derivative contracts (the passage of time). See Note 26 –
Fair Value Hedges for additional discussion and detail.
(5) Represents results from free-standing derivatives (economic hedges) used to
hedge the risk of changes in fair value of MSRs. See Note 26 – Free-Standing
Derivatives for additional discussion and detail.
The components of mortgage banking noninterest
income were: