Wells Fargo 2006 Annual Report Download - page 124
Download and view the complete annual report
Please find page 124 of the 2006 Wells Fargo annual report below. You can navigate through the pages in the report by either clicking on the pages listed below, or by using the keyword search tool below to find specific information within the annual report.-
 1
1 -
2
-
3
-
4
-
5
-
6
-
7
-
8
-
9
-
10
-
11
-
12
-
13
-
14
-
15
-
16
-
17
-
18
-
19
-
20
-
21
-
22
-
23
-
24
-
25
-
26
-
27
-
28
-
29
-
30
-
31
-
32
-
33
-
34
-
35
-
36
-
37
-
38
-
39
-
40
-
41
-
42
-
43
-
44
-
45
-
46
-
47
-
48
-
49
-
50
-
51
-
52
-
53
-
54
-
55
-
56
-
57
-
58
-
59
-
60
-
61
-
62
-
63
-
64
-
65
-
66
-
67
-
68
-
69
-
70
-
71
-
72
-
73
-
74
-
75
-
76
-
77
-
78
-
79
-
80
-
81
-
82
-
83
-
84
-
85
-
86
-
87
-
88
-
89
-
90
-
91
-
92
-
93
-
94
-
95
-
96
-
97
-
98
-
99
-
100
-
101
-
102
-
103
-
104
-
105
-
106
-
107
-
108
-
109
-
110
-
111
-
112
-
113
-
 114
114 -
 115
115 -
 116
116 -
 117
117 -
 118
118 -
 119
119 -
 120
120 -
 121
121 -
 122
122 -
 123
123 -
 124
124 -
 125
125 -
 126
126 -
 127
127 -
 128
128
 |
 |

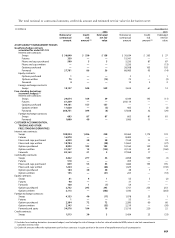
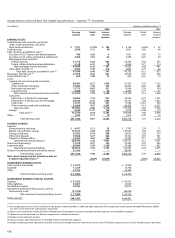
Average Balances,Yields and Rates Paid (Taxable-Equivalent Basis)— Quarterly (1)(2) (Unaudited)
(in millions) Quarter ended December 31,
2006 2005
Average Yields/ Interest Average Yields/ Interest
balance rates income/ balance rates income/
expense expense
EARNING ASSETS
Federal funds sold, securities purchased
under resale agreements and other
short-term investments $ 7,751 5.19% $ 102 $ 5,158 3.64% $ 47
Trading assets 3,950 5.12 50 5,061 3.82 48
Debt securities available for sale (3):
Securities of U.S. Treasury and federal agencies 786 4.28 9 1,051 3.90 10
Securities of U.S. states and political subdivisions 3,406 7.62 62 3,256 8.22 64
Mortgage-backed securities:
Federal agencies 31,718 6.20 483 23,545 5.94 347
Private collateralized mortgage obligations 5,130 6.19 78 8,060 5.71 114
Total mortgage-backed securities 36,848 6.20 561 31,605 5.88 461
Other debt securities (4) 6,406 7.20 115 4,843 6.79 82
Total debt securities available for sale (4) 47,446 6.40 747 40,755 6.12 617
Mortgages held for sale (3) 37,878 6.62 627 42,036 5.97 628
Loans held for sale (3) 659 7.60 13 603 6.41 10
Loans:
Commercial and commercial real estate:
Commercial 68,402 8.27 1,426 61,297 7.35 1,135
Other real estate mortgage 29,882 7.49 563 28,425 6.84 489
Real estate construction 15,775 8.07 321 13,040 7.26 239
Lease financing 5,500 5.66 78 5,347 5.77 77
Total commercial and commercial real estate 119,559 7.93 2,388 108,109 7.13 1,940
Consumer:
Real estate 1-4 family first mortgage 50,836 7.53 961 76,233 6.75 1,291
Real estate 1-4 family junior lien mortgage 68,208 8.16 1,403 58,157 7.28 1,067
Credit card 13,737 13.30 457 11,326 12.81 363
Other revolving credit and installment 53,206 9.67 1,297 46,593 9.13 1,071
Total consumer 185,987 8.80 4,118 192,309 7.84 3,792
Foreign 6,620 11.97 199 5,278 13.08 174
Total loans (5) 312,166 8.54 6,705 305,696 7.68 5,906
Other 1,333 5.17 18 1,415 4.49 16
Total earning assets $411,183 8.01 8,262 $400,724 7.23 7,272
FUNDING SOURCES
Deposits:
Interest-bearing checking $ 4,477 3.11 35 $ 3,797 1.79 17
Market rate and other savings 135,673 2.69 918 132,042 1.86 619
Savings certificates 36,382 4.33 398 26,610 3.26 219
Other time deposits 19,838 5.27 264 33,321 4.07 341
Deposits in foreign offices 24,425 4.65 286 14,347 3.71 135
Total interest-bearing deposits 220,795 3.42 1,901 210,117 2.51 1,331
Short-term borrowings 13,470 4.77 162 25,395 3.79 242
Long-term debt 85,809 5.20 1,120 79,169 4.19 832
Total interest-bearing liabilities 320,074 3.95 3,183 314,681 3.04 2,405
Portion of noninterest-bearing funding sources 91,109 — — 86,043 — —
Total funding sources $411,183 3.08 3,183 $400,724 2.39 2,405
Net interest margin and net interest income on
a taxable-equivalent basis (6) 4.93% $5,079 4.84% $4,867
NONINTEREST-EARNING ASSETS
Cash and due from banks $ 12,379 $ 13,508
Goodwill 11,259 10,780
Other 47,764 43,469
Total noninterest-earning assets $ 71,402 $ 67,757
NONINTEREST-BEARING FUNDING SOURCES
Deposits $ 91,259 $ 90,937
Other liabilities 25,687 23,049
Stockholders’ equity 45,565 39,814
Noninterest-bearing funding sources used to
fund earning assets (91,109) (86,043)
Net noninterest-bearing funding sources $ 71,402 $ 67,757
TOTAL ASSETS $482,585 $468,481
(1) Our average prime rate was 8.25% and 6.97% for the quarters ended December 31, 2006 and 2005, respectively.The average three-month London Interbank Offered Rate (LIBOR)
was 5.37% and 4.34% for the same quarters, respectively.
(2) Interest rates and amounts include the effects of hedge and risk management activities associated with the respective asset and liability categories.
(3) Yields are based on amortized cost balances computed on a settlement date basis.
(4) Includes certain preferred securities.
(5) Nonaccrual loans and related income are included in their respective loan categories.
(6) Includes taxable-equivalent adjustments primarily related to tax-exempt income on certain loans and securities. The federal statutory tax rate was 35% for both quarters presented.
122