Wells Fargo 2006 Annual Report Download - page 89
Download and view the complete annual report
Please find page 89 of the 2006 Wells Fargo annual report below. You can navigate through the pages in the report by either clicking on the pages listed below, or by using the keyword search tool below to find specific information within the annual report.-
 1
1 -
2
-
3
-
4
-
5
-
6
-
7
-
8
-
9
-
10
-
11
-
12
-
13
-
14
-
15
-
16
-
17
-
18
-
19
-
20
-
21
-
22
-
23
-
24
-
25
-
26
-
27
-
28
-
29
-
30
-
31
-
32
-
33
-
34
-
35
-
36
-
37
-
38
-
39
-
40
-
41
-
42
-
43
-
44
-
45
-
46
-
47
-
48
-
49
-
50
-
51
-
52
-
53
-
54
-
55
-
56
-
57
-
58
-
59
-
60
-
61
-
62
-
63
-
64
-
65
-
66
-
67
-
68
-
69
-
70
-
71
-
72
-
73
-
74
-
75
-
76
-
77
-
78
-
 79
79 -
 80
80 -
 81
81 -
 82
82 -
 83
83 -
 84
84 -
 85
85 -
 86
86 -
 87
87 -
 88
88 -
 89
89 -
 90
90 -
 91
91 -
 92
92 -
 93
93 -
 94
94 -
 95
95 -
 96
96 -
 97
97 -
 98
98 -
 99
99 -
100
-
101
-
102
-
103
-
104
-
105
-
106
-
107
-
108
-
109
-
110
-
111
-
112
-
113
-
114
-
115
-
116
-
117
-
118
-
119
-
120
-
121
-
122
-
123
-
124
-
125
-
126
-
127
-
128
 |
 |

87
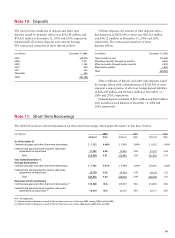
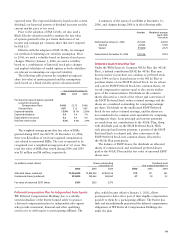
(in millions) December 31, 2006
Three months or less $15,289
After three months through six months 6,440
After six months through twelve months 2,943
After twelve months 1,850
Total $26,522
The total of time certificates of deposit and other time
deposits issued by domestic offices was $51,188 million and
$74,023 million at December 31, 2006 and 2005, respectively.
Substantially all of these deposits were interest bearing.
The contractual maturities of these deposits follow.
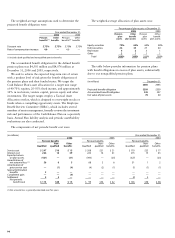
Note 10: Deposits
Of these deposits, the amount of time deposits with a
denomination of $100,000 or more was $26,522 million
and $56,123 million at December 31, 2006 and 2005,
respectively. The contractual maturities of these
deposits follow.
(in millions) December 31, 2006
2007 $45,054
2008 3,571
2009 1,182
2010 590
2011 535
Thereafter 256
Total $51,188
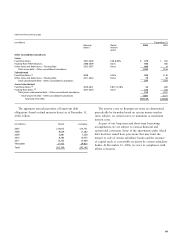
Time certificates of deposit and other time deposits issued
by foreign offices with a denomination of $100,000 or more
represent a major portion of all of our foreign deposit liabilities
of $26,200 million and $14,621 million at December 31,
2006 and 2005, respectively.
Demand deposit overdrafts of $673 million and $618 million
were included as loan balances at December 31, 2006 and
2005, respectively.
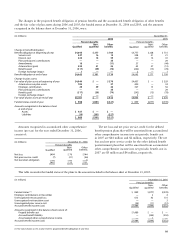
The table below shows selected information for short-term borrowings, which generally mature in less than 30 days.
Note 11: Short-Term Borrowings
(in millions) 2006 2005 2004
Amount Rate Amount Rate Amount Rate
As of December 31,
Commercial paper and other short-term borrowings $ 1,122 4.06% $ 3,958 3.80% $ 6,225 2.40%
Federal funds purchased and securities sold under
agreements to repurchase 11,707 4.88 19,934 3.99 15,737 2.04
Total $12,829 4.81 $23,892 3.96 $21,962 2.14
Year ended December 31,
Average daily balance
Commercial paper and other short-term borrowings $ 7,701 4.61% $ 9,548 3.09% $10,010 1.56%
Federal funds purchased and securities sold under
agreements to repurchase 13,770 4.62 14,526 3.09 16,120 1.22
Total $21,471 4.62 $24,074 3.09 $26,130 1.35
Maximum month-end balance
Commercial paper and other short-term borrowings (1) $14,580 N/A $15,075 N/A $16,492 N/A
Federal funds purchased and securities sold under
agreements to repurchase (2) 16,910 N/A 22,315 N/A 22,117 N/A
N/A – Not applicable.
(1) Highest month-end balance in each of the last three years was in February 2006, January 2005 and July 2004.
(2) Highest month-end balance in each of the last three years was in May 2006, August 2005 and June 2004.