Wells Fargo 2006 Annual Report Download - page 110
Download and view the complete annual report
Please find page 110 of the 2006 Wells Fargo annual report below. You can navigate through the pages in the report by either clicking on the pages listed below, or by using the keyword search tool below to find specific information within the annual report.-
 1
1 -
2
-
3
-
4
-
5
-
6
-
7
-
8
-
9
-
10
-
11
-
12
-
13
-
14
-
15
-
16
-
17
-
18
-
19
-
20
-
21
-
22
-
23
-
24
-
25
-
26
-
27
-
28
-
29
-
30
-
31
-
32
-
33
-
34
-
35
-
36
-
37
-
38
-
39
-
40
-
41
-
42
-
43
-
44
-
45
-
46
-
47
-
48
-
49
-
50
-
51
-
52
-
53
-
54
-
55
-
56
-
57
-
58
-
59
-
60
-
61
-
62
-
63
-
64
-
65
-
66
-
67
-
68
-
69
-
70
-
71
-
72
-
73
-
74
-
75
-
76
-
77
-
78
-
79
-
80
-
81
-
82
-
83
-
84
-
85
-
86
-
87
-
88
-
89
-
90
-
91
-
92
-
93
-
94
-
95
-
96
-
97
-
98
-
99
-
 100
100 -
 101
101 -
 102
102 -
 103
103 -
 104
104 -
 105
105 -
 106
106 -
 107
107 -
 108
108 -
 109
109 -
 110
110 -
 111
111 -
 112
112 -
 113
113 -
 114
114 -
 115
115 -
 116
116 -
 117
117 -
 118
118 -
 119
119 -
 120
120 -
121
-
122
-
123
-
124
-
125
-
126
-
127
-
128
 |
 |

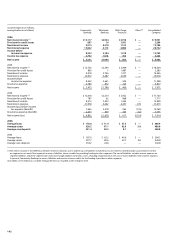
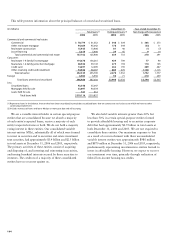
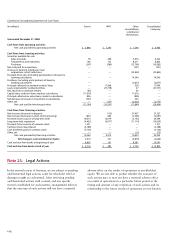
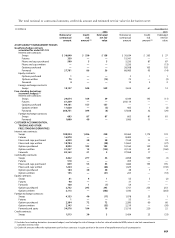
Condensed Consolidating Statements of Income
(in millions) Parent WFFI Other Eliminations Consolidated
consolidating Company
subsidiaries
Year ended December 31, 2005
Dividends from subsidiaries:
Bank $4,675 $ —$ — $(4,675) $ —
Nonbank 763 —— (763) —
Interest income from loans — 4,467 16,809 (16) 21,260
Interest income from subsidiaries 2,215 — — (2,215) —
Other interest income 105 104 4,493 —4,702
Total interest income 7,758 4,571 21,302 (7,669) 25,962
Deposits — — 3,848 —3,848
Short-term borrowings 256 223 897 (632) 744
Long-term debt 2,000 1,362 598 (1,094) 2,866
Total interest expense 2,256 1,585 5,343 (1,726) 7,458
NET INTEREST INCOME 5,502 2,986 15,959 (5,943) 18,504
Provision for credit losses —1,582 801 —2,383
Net interest income after provision for credit losses 5,502 1,404 15,158 (5,943) 16,121
NONINTEREST INCOME
Fee income –nonaffiliates —224 8,111 — 8,335
Other 298 223 5,727 (138) 6,110
Total noninterest income 298 447 13,838 (138) 14,445
NONINTEREST EXPENSE
Salaries and benefits 92 985 9,378 — 10,455
Other 50 759 8,398 (644) 8,563
Total noninterest expense 142 1,744 17,776 (644) 19,018
INCOME BEFORE INCOME TAX EXPENSE
(BENEFIT) AND EQUITY IN UNDISTRIBUTED
INCOME OF SUBSIDIARIES 5,658 107 11,220 (5,437) 11,548
Income tax expense (benefit) 145 (2) 3,734 — 3,877
Equity in undistributed income of subsidiaries 2,158 — — (2,158) —
NET INCOME $7,671 $ 109 $ 7,486 $(7,595) $ 7,671
Year ended December 31, 2004
Dividends from subsidiaries:
Bank $3,652 $ — $ — $(3,652) $ —
Nonbank 307 — — (307) —
Interest income from loans — 3,548 13,233 — 16,781
Interest income from subsidiaries 1,117 — — (1,117) —
Other interest income 91 84 4,011 —4,186
Total interest income 5,167 3,632 17,244 (5,076) 20,967
Deposits — — 1,827 — 1,827
Short-term borrowings 106 47 458 (258) 353
Long-term debt 872 1,089 387 (711) 1,637
Total interest expense 978 1,136 2,672 (969) 3,817
NET INTEREST INCOME 4,189 2,496 14,572 (4,107) 17,150
Provision for credit losses —833 884 —1,717
Net interest income after provision for credit losses 4,189 1,663 13,688 (4,107) 15,433
NONINTEREST INCOME
Fee income –nonaffiliates — 223 7,319 — 7,542
Other 139 256 5,053 (81)5,367
Total noninterest income 139 479 12,372 (81)12,909
NONINTEREST EXPENSE
Salaries and benefits 64 944 7,916 — 8,924
Other 313 746 7,820 (230) 8,649
Total noninterest expense 377 1,690 15,736 (230) 17,573
INCOME BEFORE INCOME TAX EXPENSE
(BENEFIT) AND EQUITY IN UNDISTRIBUTED
INCOME OF SUBSIDIARIES 3,951 452 10,324 (3,958) 10,769
Income tax expense (benefit) (97) 159 3,693 — 3,755
Equity in undistributed income of subsidiaries 2,966 — — (2,966) —
NET INCOME $7,014 $ 293 $ 6,631 $(6,924) $ 7,014
108