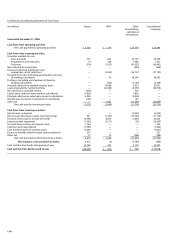
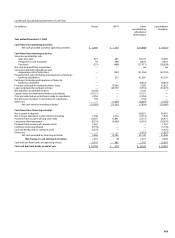
Wells Fargo 2006 Annual Report Download - page 107
Download and view the complete annual report
Please find page 107 of the 2006 Wells Fargo annual report below. You can navigate through the pages in the report by either clicking on the pages listed below, or by using the keyword search tool below to find specific information within the annual report.-
 1
1 -
2
-
3
-
4
-
5
-
6
-
7
-
8
-
9
-
10
-
11
-
12
-
13
-
14
-
15
-
16
-
17
-
18
-
19
-
20
-
21
-
22
-
23
-
24
-
25
-
26
-
27
-
28
-
29
-
30
-
31
-
32
-
33
-
34
-
35
-
36
-
37
-
38
-
39
-
40
-
41
-
42
-
43
-
44
-
45
-
46
-
47
-
48
-
49
-
50
-
51
-
52
-
53
-
54
-
55
-
56
-
57
-
58
-
59
-
60
-
61
-
62
-
63
-
64
-
65
-
66
-
67
-
68
-
69
-
70
-
71
-
72
-
73
-
74
-
75
-
76
-
77
-
78
-
79
-
80
-
81
-
82
-
83
-
84
-
85
-
86
-
87
-
88
-
89
-
90
-
91
-
92
-
93
-
94
-
95
-
96
-
 97
97 -
 98
98 -
 99
99 -
 100
100 -
 101
101 -
 102
102 -
 103
103 -
 104
104 -
 105
105 -
 106
106 -
 107
107 -
 108
108 -
 109
109 -
 110
110 -
 111
111 -
 112
112 -
 113
113 -
 114
114 -
 115
115 -
 116
116 -
 117
117 -
118
-
119
-
120
-
121
-
122
-
123
-
124
-
125
-
126
-
127
-
128
 |
 |

105
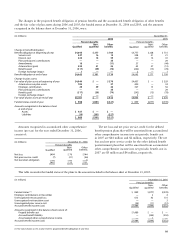
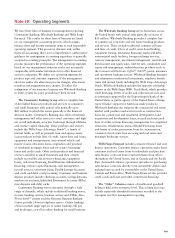
Mortgage banking activities, included in the Community
Banking and Wholesale Banking operating segments,
consist of residential and commercial mortgage originations
and servicing.
Effective January 1, 2006, upon adoption of FAS 156,
we remeasured our residential mortgage servicing rights
(MSRs) at fair value and recognized a pre-tax adjustment of
$158 million to residential MSRs and recorded a corresponding
cumulative effect adjustment of $101 million (after tax)
to increase the 2006 beginning balance of retained earnings
in stockholders’ equity. The table below reconciles the
December 31, 2005, and the January 1, 2006, balance of MSRs.
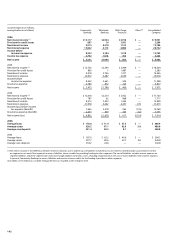
Note 21: Mortgage Banking Activities
Residential Commercial Total
(in millions) MSRs MSRs MSRs
Balance at December 31, 2005 $12,389 $122 $12,511
Remeasurement upon
adoption of FAS 156 158 —158
Balance at January 1, 2006 $12,547 $122 $12,669
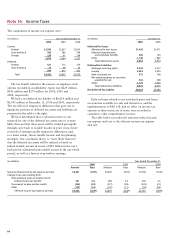
(in millions) Year ended December 31, 2006
Fair value, beginning of year $12,547
Purchases 3,859
Servicing from securitizations
or asset transfers 4,107
Sales (469)
Changes in fair value:
Due to changes in valuation
model inputs or assumptions (1) (9)
Other changes in fair value (2) (2,444)
Fair value, end of year $17,591
(1) Principally reflects changes in discount rates and prepayment speed
assumptions, mostly due to changes in interest rates.
(2) Represents changes due to collection/realization of expected cash flows
over time.
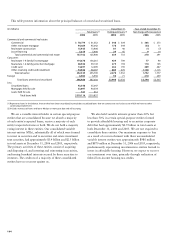
The changes in residential MSRs measured using the fair
value method were:
(in millions) Year ended December 31,
2006 2005 2004
Balance, beginning of year $122 $ 9,466 $ 8,848
Purchases (1) 278 2,683 1,353
Servicing from securitizations
or asset transfers (1) 11 2,652 1,769
Amortization (34) (1,991) (1,826)
Write-down —— (169)
Other (includes changes
due to hedging) —888 (509)
Balance, end of year $377 $13,698 $ 9,466
Valuation allowance:
Balance, beginning of year $— $ 1,565 $ 1,942
Reversal of provision for
MSRs in excess of fair value —(378) (208)
Write-down of MSRs —— (169)
Balance, end of year $— $ 1,187 $ 1,565
Amortized MSRs, net $377 $12,511 $ 7,901
Fair value of amortized MSRs:
Beginning of year $146 $ 7,913 $ 6,914
End of year 457 12,693 7,913
(1) Based on December 31, 2006, assumptions, the weighted-average amortization
period for MSRs added during the year was approximately 14.9 years.
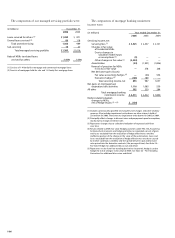
The changes in amortized MSRs were: