Wells Fargo 2006 Annual Report Download - page 44
Download and view the complete annual report
Please find page 44 of the 2006 Wells Fargo annual report below. You can navigate through the pages in the report by either clicking on the pages listed below, or by using the keyword search tool below to find specific information within the annual report.-
 1
1 -
2
-
3
-
4
-
5
-
6
-
7
-
8
-
9
-
10
-
11
-
12
-
13
-
14
-
15
-
16
-
17
-
18
-
19
-
20
-
21
-
22
-
23
-
24
-
25
-
26
-
27
-
28
-
29
-
30
-
31
-
32
-
33
-
 34
34 -
 35
35 -
 36
36 -
 37
37 -
 38
38 -
 39
39 -
 40
40 -
 41
41 -
 42
42 -
 43
43 -
 44
44 -
 45
45 -
 46
46 -
 47
47 -
 48
48 -
 49
49 -
 50
50 -
 51
51 -
 52
52 -
 53
53 -
 54
54 -
55
-
56
-
57
-
58
-
59
-
60
-
61
-
62
-
63
-
64
-
65
-
66
-
67
-
68
-
69
-
70
-
71
-
72
-
73
-
74
-
75
-
76
-
77
-
78
-
79
-
80
-
81
-
82
-
83
-
84
-
85
-
86
-
87
-
88
-
89
-
90
-
91
-
92
-
93
-
94
-
95
-
96
-
97
-
98
-
99
-
100
-
101
-
102
-
103
-
104
-
105
-
106
-
107
-
108
-
109
-
110
-
111
-
112
-
113
-
114
-
115
-
116
-
117
-
118
-
119
-
120
-
121
-
122
-
123
-
124
-
125
-
126
-
127
-
128
 |
 |

42
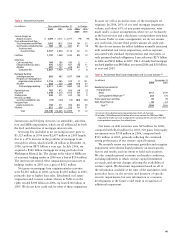
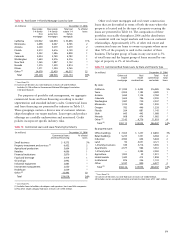
Table 3: Average Balances,Yields and Rates Paid (Taxable-Equivalent Basis) (1)(2)
(in millions) 2006 2005
Average Yields/ Interest Average Yields/ Interest
balance rates income/ balance rates income/
expense expense
EARNING ASSETS
Federal funds sold, securities purchased under
resale agreements and other short-term investments $ 5,515 4.80% $ 265 $ 5,448 3.01% $ 164
Trading assets 4,958 4.95 245 5,411 3.52 190
Debt securities available for sale
(3)
:
Securities of U.S. Treasury and federal agencies 875 4.36 39 997 3.81 38
Securities of U.S. states and political subdivisions 3,192 7.98 245 3,395 8.27 266
Mortgage-backed securities:
Federal agencies 36,691 6.04 2,206 19,768 6.02 1,162
Private collateralized mortgage obligations 6,640 6.57 430 5,128 5.60 283
Total mortgage-backed securities 43,331 6.12 2,636 24,896 5.94 1,445
Other debt securities (4) 6,204 7.10 439 3,846 7.10 266
Total debt securities available for sale
(4)
53,602 6.31 3,359 33,134 6.24 2,015
Mortgages held for sale (3) 42,855 6.41 2,746 38,986 5.67 2,213
Loans held for sale (3) 630 7.40 47 2,857 5.10 146
Loans:
Commercial and commercial real estate:
Commercial 65,720 8.13 5,340 58,434 6.76 3,951
Other real estate mortgage 29,344 7.32 2,148 29,098 6.31 1,836
Real estate construction 14,810 7.94 1,175 11,086 6.67 740
Lease financing 5,437 5.72 311 5,226 5.91 309
Total commercial and commercial real estate 115,311 7.78 8,974 103,844 6.58 6,836
Consumer:
Real estate 1-4 family first mortgage 57,509 7.27 4,182 78,170 6.42 5,016
Real estate 1-4 family junior lien mortgage 64,255 7.98 5,126 55,616 6.61 3,679
Credit card 12,571 13.29 1,670 10,663 12.33 1,315
Other revolving credit and installment 50,922 9.60 4,889 43,102 8.80 3,794
Total consumer 185,257 8.57 15,867 187,551 7.36 13,804
Foreign 6,343 12.39 786 4,711 13.49 636
Total loans (5) 306,911 8.35 25,627 296,106 7.19 21,276
Other 1,357 4.97 68 1,581 4.34 68
Total earning assets $415,828 7.79 32,357 $383,523 6.81 26,072
FUNDING SOURCES
Deposits:
Interest-bearing checking $ 4,302 2.86 123 $ 3,607 1.43 51
Market rate and other savings 134,248 2.40 3,225 129,291 1.45 1,874
Savings certificates 32,355 3.91 1,266 22,638 2.90 656
Other time deposits 32,168 4.99 1,607 27,676 3.29 910
Deposits in foreign offices 20,724 4.60 953 11,432 3.12 357
Total interest-bearing deposits 223,797 3.21 7,174 194,644 1.98 3,848
Short-term borrowings 21,471 4.62 992 24,074 3.09 744
Long-term debt 84,035 4.91 4,124 79,137 3.62 2,866
Guaranteed preferred beneficial interests in Company’s
subordinated debentures (6) — — — — — —
Total interest-bearing liabilities 329,303 3.73 12,290 297,855 2.50 7,458
Portion of noninterest-bearing funding sources 86,525 — — 85,668 — —
Total funding sources $415,828 2.96 12,290 $383,523 1.95 7,458
Net interest margin and net interest income on
a taxable-equivalent basis (7) 4.83% $20,067 4.86% $18,614
NONINTEREST-EARNING ASSETS
Cash and due from banks $ 12,466 $ 13,173
Goodwill 11,114 10,705
Other 46,615 38,389
Total noninterest-earning assets $ 70,195 $ 62,267
NONINTEREST-BEARING FUNDING SOURCES
Deposits $ 89,117 $ 87,218
Other liabilities 24,430 21,559
Stockholders’ equity 43,173 39,158
Noninterest-bearing funding sources used to
fund earning assets (86,525) (85,668)
Net noninterest-bearing funding sources $ 70,195 $ 62,267
TOTAL ASSETS $486,023 $445,790
(1) Our average prime rate was 7.96%, 6.19%, 4.34%, 4.12% and 4.68% for 2006, 2005, 2004, 2003 and 2002, respectively.The average three-month London Interbank
Offered Rate (LIBOR) was 5.20%, 3.56%, 1.62%, 1.22% and 1.80% for the same years, respectively.
(2) Interest rates and amounts include the effects of hedge and risk management activities associated with the respective asset and liability categories.
(3) Yields are based on amortized cost balances computed on a settlement date basis.
(4) Includes certain preferred securities.