Wells Fargo 2006 Annual Report Download - page 72
Download and view the complete annual report
Please find page 72 of the 2006 Wells Fargo annual report below. You can navigate through the pages in the report by either clicking on the pages listed below, or by using the keyword search tool below to find specific information within the annual report.-
 1
1 -
2
-
3
-
4
-
5
-
6
-
7
-
8
-
9
-
10
-
11
-
12
-
13
-
14
-
15
-
16
-
17
-
18
-
19
-
20
-
21
-
22
-
23
-
24
-
25
-
26
-
27
-
28
-
29
-
30
-
31
-
32
-
33
-
34
-
35
-
36
-
37
-
38
-
39
-
40
-
41
-
42
-
43
-
44
-
45
-
46
-
47
-
48
-
49
-
50
-
51
-
52
-
53
-
54
-
55
-
56
-
57
-
58
-
59
-
60
-
61
-
 62
62 -
 63
63 -
 64
64 -
 65
65 -
 66
66 -
 67
67 -
 68
68 -
 69
69 -
 70
70 -
 71
71 -
 72
72 -
 73
73 -
 74
74 -
 75
75 -
 76
76 -
 77
77 -
 78
78 -
 79
79 -
 80
80 -
 81
81 -
 82
82 -
83
-
84
-
85
-
86
-
87
-
88
-
89
-
90
-
91
-
92
-
93
-
94
-
95
-
96
-
97
-
98
-
99
-
100
-
101
-
102
-
103
-
104
-
105
-
106
-
107
-
108
-
109
-
110
-
111
-
112
-
113
-
114
-
115
-
116
-
117
-
118
-
119
-
120
-
121
-
122
-
123
-
124
-
125
-
126
-
127
-
128
 |
 |

70
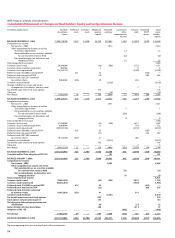
Wells Fargo & Company and Subsidiaries
Consolidated Statement of Changes in Stockholders’ Equity and Comprehensive Income
(in millions, except shares)
Number Preferred Common Additional Retained Cumulative Treasury Unearned Total
of common stock stock paid-in earnings other stock ESOP stock-
shares capital comprehensive shares holders’
income equity
BALANCE DECEMBER 31, 2003 3,396,218,748 $ 214 $5,788 $6,749 $22,842 $ 938 $ (1,833)$(229)$34,469
Comprehensive income:
Net income – 2004 7,014 7,014
Other comprehensive income, net of tax:
Translation adjustments 12 12
Net unrealized losses on securities available
for sale and other interests held (22) (22)
Net unrealized gains on derivatives and
hedging activities 22 22
Total comprehensive income 7,026
Common stock issued 59,939,306 (46) (206) 1,523 1,271
Common stock issued for acquisitions 306,964 1 8 9
Common stock repurchased (76,345,112) (2,188) (2,188)
Preferred stock (321,000) issued to ESOP 321 23 (344) —
Preferred stock released to ESOP (19) 284 265
Preferred stock (265,537) converted
to common shares 9,063,368 (265) 29 236 —
Common stock dividends (3,150) (3,150)
Change in Rabbi trust assets and similar
arrangements (classified as treasury stock) 77
Tax benefit upon exercise of stock options 175 175
Other, net _____________ _____ ______ ______ (18)_____ _______ _____ (18)
Net change (7,035,474) 56 — 163 3,640 12 (414) (60) 3,397
BALANCE DECEMBER 31, 2004 3,389,183,274 270 5,788 6,912 26,482 950 (2,247) (289) 37,866
Comprehensive income:
Net income – 2005 7,671 7,671
Other comprehensive income, net of tax:
Translation adjustments 55
Net unrealized losses on securities available
for sale and other interests held (298) (298)
Net unrealized gains on derivatives and
hedging activities 8 8
Total comprehensive income 7,386
Common stock issued 57,528,986 (52) (198) 1,617 1,367
Common stock issued for acquisitions 3,909,004 12 110 122
Common stock repurchased (105,597,728) (3,159) (3,159)
Preferred stock (363,000) issued to ESOP 362 25 (387) —
Preferred stock released to ESOP (21) 328 307
Preferred stock (307,100) converted
to common shares 10,142,528 (307) 21 286 —
Common stock dividends (3,375) (3,375)
Tax benefit upon exercise of stock options 143 143
Other, net ______________ _____ _______ _______ _________ ______ 3 _____ 3
Net change (34,017,210) 55 — 128 4,098 (285) (1,143) (59) 2,794
BALANCE DECEMBER 31, 2005 3,355,166,064 325 5,788 7,040 30,580 665 (3,390) (348) 40,660
Cumulative effect from adoption of FAS 156 101 101
BALANCE JANUARY 1, 2006 3,355,166,064 325 5,788 7,040 30,681 665 (3,390) (348) 40,761
Comprehensive income:
Net income – 2006 8,482 8,482
Other comprehensive income, net of tax:
Net unrealized losses on securities available
for sale and other interests held (31) (31)
Net unrealized gains on derivatives and
hedging activities 70 70
Total comprehensive income 8,521
Common stock issued 70,063,930 (67) (245) 2,076 1,764
Common stock repurchased (58,534,072) (1,965) (1,965)
Preferred stock (414,000) issued to ESOP 414 29 (443) —
Preferred stock released to ESOP (25) 380 355
Preferred stock (355,659) converted
to common shares 10,453,939 (355) 41 314 —
Common stock dividends (3,641) (3,641)
Tax benefit upon exercise of stock options 229 229
Stock option compensation expense 134 134
Net change in deferred compensation and
related plans 50 (27) 23
Reclassification of share-based plans 308 (211) 97
Adoption of FAS 158 _____________ _____ ______ ______ _______ (402)_______ _____ (402)
Net change 21,983,797 59 — 699 4,596 (363) 187 (63) 5,115
BALANCE DECEMBER 31, 2006 3,377,149,861 $ 384 $5,788 $7,739 $35,277 $ 302 $(3,203) $(411) $45,876
The accompanying notes are an integral part of these statements.