Wells Fargo 2006 Annual Report Download - page 49
Download and view the complete annual report
Please find page 49 of the 2006 Wells Fargo annual report below. You can navigate through the pages in the report by either clicking on the pages listed below, or by using the keyword search tool below to find specific information within the annual report.-
 1
1 -
2
-
3
-
4
-
5
-
6
-
7
-
8
-
9
-
10
-
11
-
12
-
13
-
14
-
15
-
16
-
17
-
18
-
19
-
20
-
21
-
22
-
23
-
24
-
25
-
26
-
27
-
28
-
29
-
30
-
31
-
32
-
33
-
34
-
35
-
36
-
37
-
38
-
 39
39 -
 40
40 -
 41
41 -
 42
42 -
 43
43 -
 44
44 -
 45
45 -
 46
46 -
 47
47 -
 48
48 -
 49
49 -
 50
50 -
 51
51 -
 52
52 -
 53
53 -
 54
54 -
 55
55 -
 56
56 -
 57
57 -
 58
58 -
 59
59 -
60
-
61
-
62
-
63
-
64
-
65
-
66
-
67
-
68
-
69
-
70
-
71
-
72
-
73
-
74
-
75
-
76
-
77
-
78
-
79
-
80
-
81
-
82
-
83
-
84
-
85
-
86
-
87
-
88
-
89
-
90
-
91
-
92
-
93
-
94
-
95
-
96
-
97
-
98
-
99
-
100
-
101
-
102
-
103
-
104
-
105
-
106
-
107
-
108
-
109
-
110
-
111
-
112
-
113
-
114
-
115
-
116
-
117
-
118
-
119
-
120
-
121
-
122
-
123
-
124
-
125
-
126
-
127
-
128
 |
 |

47
Balance Sheet Analysis
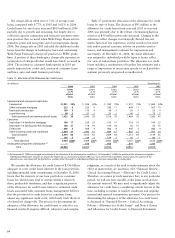
Table 8: Mortgage-Backed Securities
(in billions) Fair Net unrealized Remaining
value gain (loss) maturity
At December 31, 2006 $31.5 $ 0.5 4.2 yrs.
At December 31, 2006,
assuming a 200 basis point:
Increase in interest rates 29.0 (2.0) 7.0 yrs.
Decrease in interest rates 32.0 1.0 1.1 yrs.
Table 10: Deposits
(in millions) December 31,%
2006 2005 Change
Noninterest-bearing $ 89,119 $ 87,712 2%
Interest-bearing checking 3,540 3,324 6
Market rate and
other savings 140,283 134,811 4
Savings certificates 37,282 27,494 36
Core deposits 270,224 253,341 7
Other time deposits 13,819 46,488 (70)
Deposits in foreign offices 26,200 14,621 79
Total deposits $310,243 $314,450 (1)
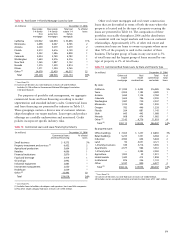
Table 9: Maturities for Selected Loan Categories
(in millions) December 31, 2006
Within After After Total
one one year five
year through years
fiveyears
Selected loan maturities:
Commercial $21,735 $35,309 $13,360 $ 70,404
Other real estate mortgage 3,724 11,247 15,141 30,112
Real estate construction 7,114 7,481 1,340 15,935
Foreign 828 4,752 1,086 6,666
Total selected loans $33,401 $58,789 $30,927 $123,117
Sensitivity of loans due after
one year to changes in
interest rates:
Loans at fixed interest rates $12,181 $ 9,108
Loans at floating/variable
interest rates 46,608 21,819
Total selected loans $58,789 $30,927
increased $13.2 billion, or 12%, compared with a year
ago. Mortgages held for sale decreased to $33.1 billion at
December 31, 2006, from $40.5 billion a year ago.
Table 9 shows contractual loan maturities and interest
rate sensitivities for selected loan categories.
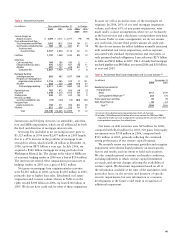
Deposits
Year-end deposit balances are shown in Table 10. Comparative
detail of average deposit balances is included in Table 3.
Average core deposits increased $17.2 billion to $260.0 billion
in 2006 from $242.8 billion in 2005, primarily due to an
increase in savings certificates. Average core deposits funded
53.5% and 54.5% of average total assets in 2006 and 2005,
respectively. Total average interest-bearing deposits increased
to $223.8 billion in 2006 from $194.6 billion in 2005, largely
due to organic growth. Total average noninterest-bearing
deposits rose to $89.1 billion in 2006 from $87.2 billion in
2005. Savings certificates increased on average to $32.4 billion
in 2006 from $22.6 billion in 2005.
Securities Available for Sale
Our securities available for sale portfolio consists of both
debt and marketable equity securities. We hold debt securities
available for sale primarily for liquidity, interest rate risk
management and yield enhancement. Accordingly, this
portfolio primarily includes very liquid, high-quality federal
agency debt securities. At December 31, 2006, we held
$41.8 billion of debt securities available for sale, compared
with $40.9 billion at December 31, 2005, with a net unrealized
gain of $722 million and $591 million for the same periods,
respectively. We also held $796 million of marketable equity
securities available for sale at December 31, 2006, and
$900 million at December 31, 2005, with a net unrealized
gain of $204 million and $342 million for the same periods,
respectively.
The weighted-average expected maturity of debt securities
available for sale was 5.2 years at December 31, 2006. Since
75% of this portfolio is mortgage-backed securities, the
expected remaining maturity may differ from contractual
maturity because borrowers may have the right to prepay
obligations before the underlying mortgages mature.
The estimated effect of a 200 basis point increase or
decrease in interest rates on the fair value and the expected
remaining maturity of the mortgage-backed securities avail-
able for sale portfolio is shown in Table 8 below.
See Note 5 (Securities Available for Sale) to Financial
Statements for securities available for sale by security type.
Loan Portfolio
A comparative schedule of average loan balances is included
in Table 3; year-end balances are in Note 6 (Loans and
Allowance for Credit Losses) to Financial Statements.
Total loans at December 31, 2006, were $319.1 billion,
compared with $310.8 billion at year-end 2005, an increase
of 3%. Consumer loans of $190.4 billion at December 31, 2006,
decreased 3% from $196.4 billion a year ago. Excluding 1-4 family
first mortgages (the category affected by ARMs sales), consumer
loans increased 16% from 2005. Commercial and commercial
real estate loans of $122.1 billion at December 31, 2006,
from Hurricane Katrina. Total revenue rose 16% in 2006,
reaching $5.4 billion, compared with $4.7 billion in 2005,
due to higher net interest income. Average loans were
$57.5 billion in 2006, up from $46.9 billion in 2005.
Noninterest expense increased $247 million, or 10%, in
2006 from 2005, reflecting investments in new consumer
finance stores and additional team members.