Wells Fargo 2006 Annual Report Download - page 48
Download and view the complete annual report
Please find page 48 of the 2006 Wells Fargo annual report below. You can navigate through the pages in the report by either clicking on the pages listed below, or by using the keyword search tool below to find specific information within the annual report.-
 1
1 -
2
-
3
-
4
-
5
-
6
-
7
-
8
-
9
-
10
-
11
-
12
-
13
-
14
-
15
-
16
-
17
-
18
-
19
-
20
-
21
-
22
-
23
-
24
-
25
-
26
-
27
-
28
-
29
-
30
-
31
-
32
-
33
-
34
-
35
-
36
-
37
-
 38
38 -
 39
39 -
 40
40 -
 41
41 -
 42
42 -
 43
43 -
 44
44 -
 45
45 -
 46
46 -
 47
47 -
 48
48 -
 49
49 -
 50
50 -
 51
51 -
 52
52 -
 53
53 -
 54
54 -
 55
55 -
 56
56 -
 57
57 -
 58
58 -
59
-
60
-
61
-
62
-
63
-
64
-
65
-
66
-
67
-
68
-
69
-
70
-
71
-
72
-
73
-
74
-
75
-
76
-
77
-
78
-
79
-
80
-
81
-
82
-
83
-
84
-
85
-
86
-
87
-
88
-
89
-
90
-
91
-
92
-
93
-
94
-
95
-
96
-
97
-
98
-
99
-
100
-
101
-
102
-
103
-
104
-
105
-
106
-
107
-
108
-
109
-
110
-
111
-
112
-
113
-
114
-
115
-
116
-
117
-
118
-
119
-
120
-
121
-
122
-
123
-
124
-
125
-
126
-
127
-
128
 |
 |

46
In 2006, we continued to focus on building our business with
investments in additional team members and new banking
stores. The 9% increase in noninterest expense to $20.7 billion
in 2006 from $19.0 billion in 2005 was due primarily to
the increase in salaries, incentive compensation and employee
benefits. We grew our sales and service force by adding
4,497 team members (full-time equivalents), including
1,914 retail platform bankers and 110 private bankers.
Incentive compensation in 2006 also included $134 million
of stock option expense, which we are required to recognize
under FAS 123(R), Share-Based Payment, adopted in 2006.
In 2006, we opened 109 regional banking stores and we
remodeled 528 of our banking stores. We expect to open
another 100 regional banking stores in 2007.
Operating Segment Results
We have three lines of business for management reporting:
Community Banking, Wholesale Banking and Wells Fargo
Financial. For a more complete description of our operating
segments, including additional financial information and the
underlying management accounting process, see Note 19
(Operating Segments) to Financial Statements.
Segment results for prior periods have been revised due
to the realignment of our insurance business into Wholesale
Banking in 2006, designed to leverage the expertise, systems
and resources of the existing businesses.
COMMUNITY BANKING’S net income increased to $5.53 billion
in 2006 from $5.47 billion in 2005. Total revenue for 2006
increased $912 million, or 4%, driven by an improved net
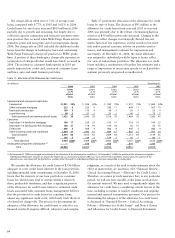
Noninterest Expense
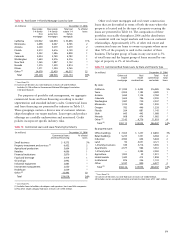
Table 7: Noninterest Expense
(in millions) Year ended December 31, % Change
2006 2005 2004 2006/ 2005/
2005 2004
Salaries $ 7,007 $ 6,215 $ 5,393 13% 15%
Incentive compensation 2,885 2,366 1,807 22 31
Employee benefits 2,035 1,874 1,724 99
Equipment 1,252 1,267 1,236 (1) 3
Net occupancy 1,405 1,412 1,208 —17
Operating leases 630 635 633 (1) —
Outside professional services 942 835 669 13 25
Contract services 579 596 626 (3) (5)
Travel and entertainment 542 481 442 13 9
Advertising and promotion 456 443 459 3(3)
Outside data processing 437 449 418 (3) 7
Postage 312 281 269 11 4
Telecommunications 279 278 296 —(6)
Insurance 257 224 247 15 (9)
Stationery and supplies 223 205 240 9(15)
Operating losses 180 194 192 (7) 1
Security 179 167 161 74
Core deposit intangibles 112 123 134 (9) (8)
Charitable donations 59 61 248 (3) (75)
Net losses from debt
extinguishment 24 11 174 118 (94)
All other 947 901 997 5(10)
Total $20,742 $19,018 $17,573 98
interest margin resulting from solid loan and deposit growth.
Excluding real estate 1-4 family mortgages—the loan cate-
gory affected by the sales of ARMs during the year—total
average loans grew $15.1 billion, or 12%. Average deposit
growth was $18.8 billion, or 7%, and was driven by a 5%
increase in consumer checking accounts and 4% growth in
business checking accounts. Noninterest income increased
$497 million, or 5%, primarily due to strong double-digit
growth in debit and credit card fees, trust and investment
fees, and service charge fee income, driven by the growth in
both consumer and business checking accounts, partially
offset by lower mortgage banking noninterest income. The
provision for credit losses for 2006 decreased $8 million
from 2005, which included incremental losses due to the
change to the bankruptcy law in 2005. Noninterest expense
for 2006 increased $850 million, or 7%, due to the addition
of 2,800 sales and service team members, including 1,914 retail
platform bankers, the opening of 109 banking stores, 246
net new webATM®machines and investments in technology.
WHOLESALE BANKING’S net income was a record $2.09 billion
in 2006, up 17% from $1.79 billion in 2005, driven largely
by an 11% increase in earning assets and an expanding
net interest margin, as well as continued low credit losses.
Average loans increased 15% to $71.4 billion in 2006 from
$62.2 billion in 2005, with double-digit increases across
the majority of the wholesale lending businesses. Average
deposits grew 45% entirely due to increases in interest-bearing
deposits, driven by a mix of organic customer growth,
conversions of customer sweep accounts from off-balance
sheet money market funds into deposits, and continued
growth in foreign central bank deposits. The provision for
credit losses was $16 million in 2006 and $1 million in
2005. Noninterest income increased 15% to $4.31 billion in
2006, due to acquisitions of fee-generating businesses such
as Secured Capital, Reilly Mortgage, Barrington Associates
and Evergreen Funding, along with stronger asset management,
capital markets, insurance and foreign exchange revenue.
Noninterest expense increased 18% to $4.11 billion in 2006
from $3.49 billion in 2005, due to higher personnel-related
expenses, including staff additions, along with higher expenses
from acquisitions, expenses related to higher sales volumes,
and investments in new offices, businesses and systems.
WELLS FARGO FINANCIAL’S net income increased 111% to
$865 million in 2006 from $409 million in 2005. Net income
in 2006 was reduced by an increase of $160 million (pre tax)
in auto losses partially due to growth and seasoning, but
largely due to collection capacity constraints and restrictive
payment extension practices during the integration of the prime
and non-prime auto loan businesses. Net income for 2006
also included a $50 million (pre tax) release of provision for
credit losses releasing the remaining portion of the provision
made for Hurricane Katrina. Net income for 2005 included
incremental losses due to the change in the bankruptcy law, a
first quarter 2005 $163 million charge (pre tax) to conform
Wells Fargo Financial’s charge-off practices with FFIEC
guidelines, and $100 million (pre tax) for estimated losses