Wells Fargo 2006 Annual Report Download - page 123
Download and view the complete annual report
Please find page 123 of the 2006 Wells Fargo annual report below. You can navigate through the pages in the report by either clicking on the pages listed below, or by using the keyword search tool below to find specific information within the annual report.-
 1
1 -
2
-
3
-
4
-
5
-
6
-
7
-
8
-
9
-
10
-
11
-
12
-
13
-
14
-
15
-
16
-
17
-
18
-
19
-
20
-
21
-
22
-
23
-
24
-
25
-
26
-
27
-
28
-
29
-
30
-
31
-
32
-
33
-
34
-
35
-
36
-
37
-
38
-
39
-
40
-
41
-
42
-
43
-
44
-
45
-
46
-
47
-
48
-
49
-
50
-
51
-
52
-
53
-
54
-
55
-
56
-
57
-
58
-
59
-
60
-
61
-
62
-
63
-
64
-
65
-
66
-
67
-
68
-
69
-
70
-
71
-
72
-
73
-
74
-
75
-
76
-
77
-
78
-
79
-
80
-
81
-
82
-
83
-
84
-
85
-
86
-
87
-
88
-
89
-
90
-
91
-
92
-
93
-
94
-
95
-
96
-
97
-
98
-
99
-
100
-
101
-
102
-
103
-
104
-
105
-
106
-
107
-
108
-
109
-
110
-
111
-
112
-
 113
113 -
 114
114 -
 115
115 -
 116
116 -
 117
117 -
 118
118 -
 119
119 -
 120
120 -
 121
121 -
 122
122 -
 123
123 -
 124
124 -
 125
125 -
 126
126 -
 127
127 -
 128
128
 |
 |

121121
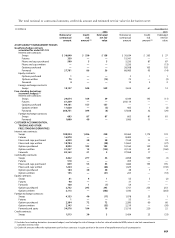
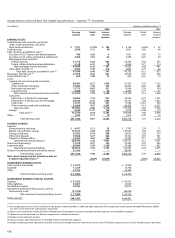
Quarterly Financial Data
Condensed Consolidated Statement of Income — Quarterly (1) (Unaudited)
(in millions, except per share amounts) 2006 2005
Quarter ended Quarter ended
Dec. 31 Sept. 30 June 30 Mar. 31 Dec. 31 Sept. 30 June 30 Mar. 31
INTEREST INCOME $ 8,231 $ 8,399 $ 8,077 $ 7,532 $ 7,244 $ 6,645 $ 6,200 $ 5,873
INTEREST EXPENSE 3,181 3,352 3,093 2,662 2,405 1,969 1,664 1,420
NET INTEREST INCOME 5,050 5,047 4,984 4,870 4,839 4,676 4,536 4,453
Provision for credit losses 726 613 432 433 703 641 454 585
Net interest income after provision for credit losses 4,324 4,434 4,552 4,437 4,136 4,035 4,082 3,868
NONINTEREST INCOME
Service charges on deposit accounts 695 707 665 623 655 654 625 578
Trust and investment fees 735 664 675 663 623 614 597 602
Card fees 481 464 418 384 394 377 361 326
Other fees 550 509 510 488 478 520 478 453
Mortgage banking 677 484 735 415 628 743 237 814
Operating leases 190 192 200 201 200 202 202 208
Insurance 299 313 364 364 272 248 358 337
Net gains (losses) on debt securities available for sale 51 121 (156) (35) (124) (31) 39 (4)
Net gains from equity investments 256 159 133 190 93 146 201 71
Other 429 274 261 392 434 354 231 251
Total noninterest income 4,363 3,887 3,805 3,685 3,653 3,827 3,329 3,636
NONINTEREST EXPENSE
Salaries 1,812 1,769 1,754 1,672 1,613 1,571 1,551 1,480
Incentive compensation 793 710 714 668 663 676 562 465
Employee benefits 501 458 487 589 428 467 432 547
Equipment 339 294 284 335 328 306 263 370
Net occupancy 367 357 345 336 344 354 310 404
Operating leases 157 155 157 161 161 159 157 158
Other 1,442 1,338 1,435 1,313 1,346 1,356 1,279 1,268
Total noninterest expense 5,411 5,081 5,176 5,074 4,883 4,889 4,554 4,692
INCOME BEFORE INCOME TAX EXPENSE 3,276 3,240 3,181 3,048 2,906 2,973 2,857 2,812
Income tax expense 1,095 1,046 1,092 1,030 976 998 947 956
NET INCOME $ 2,181 $ 2,194 $ 2,089 $ 2,018 $ 1,930 $ 1,975 $ 1,910 $ 1,856
EARNINGS PER COMMON SHARE $ 0.65 $ 0.65 $ 0.62 $ 0.60 $ 0.57 $ 0.59 $ 0.56 $ 0.55
DILUTED EARNINGS PER COMMON SHARE $ 0.64 $ 0.64 $ 0.61 $ 0.60 $ 0.57 $ 0.58 $ 0.56 $ 0.54
DIVIDENDS DECLARED PER COMMON SHARE $ 0.28 $ — $ 0.54 $ 0.26 $ 0.26 $ 0.26 $ 0.24 $ 0.24
Average common shares outstanding 3,379.4 3,371.9 3,363.8 3,358.3 3,350.8 3,373.5 3,375.4 3,390.8
Diluted average common shares outstanding 3,424.0 3,416.0 3,404.4 3,395.7 3,387.8 3,410.6 3,414.4 3,431.5
Market price per common share (2)
High $ 36.99 $ 36.89 $ 34.86 $ 32.76 $ 32.35 $ 31.44 $ 31.11 $ 31.38
Low 34.90 33.36 31.90 30.31 28.81 29.00 28.89 29.08
Quarter end 35.56 36.18 33.54 31.94 31.42 29.29 30.79 29.90
(1) All common share and per share disclosures reflect the two-for-one split in the form of a 100% stock dividend distributed August 11, 2006.
(2) Based on daily prices reported on the New York Stock Exchange Composite Transaction Reporting System.