Wells Fargo 2006 Annual Report Download - page 104
Download and view the complete annual report
Please find page 104 of the 2006 Wells Fargo annual report below. You can navigate through the pages in the report by either clicking on the pages listed below, or by using the keyword search tool below to find specific information within the annual report.-
 1
1 -
2
-
3
-
4
-
5
-
6
-
7
-
8
-
9
-
10
-
11
-
12
-
13
-
14
-
15
-
16
-
17
-
18
-
19
-
20
-
21
-
22
-
23
-
24
-
25
-
26
-
27
-
28
-
29
-
30
-
31
-
32
-
33
-
34
-
35
-
36
-
37
-
38
-
39
-
40
-
41
-
42
-
43
-
44
-
45
-
46
-
47
-
48
-
49
-
50
-
51
-
52
-
53
-
54
-
55
-
56
-
57
-
58
-
59
-
60
-
61
-
62
-
63
-
64
-
65
-
66
-
67
-
68
-
69
-
70
-
71
-
72
-
73
-
74
-
75
-
76
-
77
-
78
-
79
-
80
-
81
-
82
-
83
-
84
-
85
-
86
-
87
-
88
-
89
-
90
-
91
-
92
-
93
-
 94
94 -
 95
95 -
 96
96 -
 97
97 -
 98
98 -
 99
99 -
 100
100 -
 101
101 -
 102
102 -
 103
103 -
 104
104 -
 105
105 -
 106
106 -
 107
107 -
 108
108 -
 109
109 -
 110
110 -
 111
111 -
 112
112 -
 113
113 -
 114
114 -
115
-
116
-
117
-
118
-
119
-
120
-
121
-
122
-
123
-
124
-
125
-
126
-
127
-
128
 |
 |

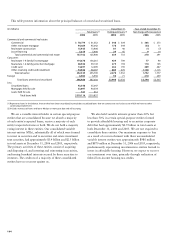
102
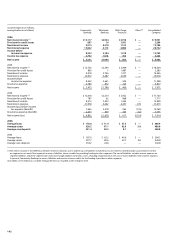
(income/expense in millions,
average balances in billions) Community Wholesale Wells Fargo Other
(2)
Consolidated
Banking Banking Financial
Company
2006
Net interest income (1) $13,117 $2,924 $3,910 $ — $19,951
Provision for credit losses 887 16 1,301 — 2,204
Noninterest income 9,915 4,310 1,515 — 15,740
Noninterest expense 13,822 4,114 2,806 —20,742
Income before
income tax expense 8,323 3,104 1,318 — 12,745
Income tax expense 2,792 1,018 453 —4,263
Net income $ 5,531 $2,086 $ 865 $ — $ 8,482
2005
Net interest income (1) $ 12,702 $ 2,393 $ 3,409 $ — $ 18,504
Provision for credit losses 895 1 1,487 — 2,383
Noninterest income 9,418 3,756 1,271 — 14,445
Noninterest expense 12,972 3,487 2,559 —19,018
Income before
income tax expense 8,253 2,661 634 — 11,548
Income tax expense 2,780 872 225 —3,877
Net income $ 5,473 $ 1,789 $ 409 $ — $ 7,671
2004
Net interest income (1) $ 12,018 $ 2,210 $ 2,922 $ — $ 17,150
Provision for credit losses 787 62 868 — 1,717
Noninterest income 8,212 3,432 1,265 — 12,909
Noninterest expense 11,978 3,062 2,357 176 17,573
Income (loss) before income
tax expense (benefit) 7,465 2,518 962 (176) 10,769
Income tax expense (benefit) 2,633 839 345 (62)3,755
Net income (loss) $ 4,832 $ 1,679 $ 617 $(114) $ 7,014
2006
Average loans $ 178.0 $ 71.4 $ 57.5 $ — $ 306.9
Average assets 320.2 97.1 62.9 5.8 486.0
Average core deposits 231.4 28.5 0.1 — 260.0
2005
Average loans $ 187.0 $ 62.2 $ 46.9 $ — $ 296.1
Average assets 297.7 89.6 52.7 5.8 445.8
Average core deposits 218.2 24.6 — — 242.8
(1) Net interest income is the difference between interest earned on assets and the cost of liabilities to fund those assets. Interest earned includes actual interest earned
on segment assets and, if the segment has excess liabilities, interest credits for providing funding to other segments.The cost of liabilities includes interest expense on
segment liabilities and, if the segment does not have enough liabilities to fund its assets, a funding charge based on the cost of excess liabilities from another segment.
In general, Community Banking has excess liabilities and receives interest credits for the funding it provides to other segments.
(2) In 2004, a $176 million loss on debt extinguishment was recorded at the enterprise level.