Wells Fargo 2006 Annual Report Download - page 38
Download and view the complete annual report
Please find page 38 of the 2006 Wells Fargo annual report below. You can navigate through the pages in the report by either clicking on the pages listed below, or by using the keyword search tool below to find specific information within the annual report.-
 1
1 -
2
-
3
-
4
-
5
-
6
-
7
-
8
-
9
-
10
-
11
-
12
-
13
-
14
-
15
-
16
-
17
-
18
-
19
-
20
-
21
-
22
-
23
-
24
-
25
-
26
-
27
-
 28
28 -
 29
29 -
 30
30 -
 31
31 -
 32
32 -
 33
33 -
 34
34 -
 35
35 -
 36
36 -
 37
37 -
 38
38 -
 39
39 -
 40
40 -
 41
41 -
 42
42 -
 43
43 -
 44
44 -
 45
45 -
 46
46 -
 47
47 -
 48
48 -
49
-
50
-
51
-
52
-
53
-
54
-
55
-
56
-
57
-
58
-
59
-
60
-
61
-
62
-
63
-
64
-
65
-
66
-
67
-
68
-
69
-
70
-
71
-
72
-
73
-
74
-
75
-
76
-
77
-
78
-
79
-
80
-
81
-
82
-
83
-
84
-
85
-
86
-
87
-
88
-
89
-
90
-
91
-
92
-
93
-
94
-
95
-
96
-
97
-
98
-
99
-
100
-
101
-
102
-
103
-
104
-
105
-
106
-
107
-
108
-
109
-
110
-
111
-
112
-
113
-
114
-
115
-
116
-
117
-
118
-
119
-
120
-
121
-
122
-
123
-
124
-
125
-
126
-
127
-
128
 |
 |

36
of Katrina-related losses. Because we no longer anticipate
further credit losses attributable to Katrina, we released the
remaining $50 million reserve in 2006. The allowance for
credit losses, which consists of the allowance for loan losses
and the reserve for unfunded credit commitments, was
$3.96 billion, or 1.24% of total loans, at December 31, 2006,
compared with $4.06 billion, or 1.31%, at December 31, 2005.
At December 31, 2006, total nonaccrual loans were
$1.67 billion (0.52% of total loans) up from $1.34 billion
(0.43%) at December 31, 2005. Total nonperforming assets
were $2.42 billion (0.76% of total loans) at December 31,
2006, compared with $1.53 billion (0.49%) at December 31,
2005. Foreclosed assets were $745 million at December 31,
2006, compared with $191 million at December 31, 2005.
Foreclosed assets, a component of total nonperforming
assets, included an additional $322 million of foreclosed real
estate securing Government National Mortgage Association
(GNMA) loans at December 31, 2006, due to a change in
regulatory reporting requirements effective January 1, 2006.
The foreclosed real estate securing GNMA loans of $322 million
represented 10 basis points of the ratio of nonperforming
assets to loans at December 31, 2006. Both principal and
interest for the GNMA loans secured by the foreclosed real
estate are fully collectible because the GNMA loans are insured
by the Federal Housing Administration (FHA) or guaranteed
by the Department of Veterans Affairs.
The ratio of stockholders’ equity to total assets was
9.52% at December 31, 2006, compared with 8.44% at
December 31, 2005. Our total risk-based capital (RBC) ratio
at December 31, 2006, was 12.50% and our Tier 1 RBC ratio
was 8.95%, exceeding the minimum regulatory guidelines
of 8% and 4%, respectively, for bank holding companies.
Our RBC ratios at December 31, 2005, were 11.64% and
8.26%, respectively. Our Tier 1 leverage ratios were 7.89%
and 6.99% at December 31, 2006 and 2005, respectively,
exceeding the minimum regulatory guideline of 3% for bank
holding companies.
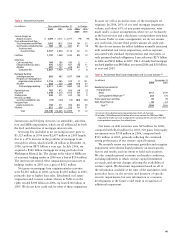
Table 2: Six-Year Summary of Selected Financial Data
(in millions, except % Change Five-year
per share amounts) 2006/ compound
2006 2005 2004 2003 2002 2001 2005 growth rate
INCOME STATEMENT
Net interest income $ 19,951 $ 18,504 $ 17,150 $ 16,007 $ 14,482 $ 11,976 8% 11%
Noninterest income 15,740 14,445 12,909 12,382 10,767 9,005 912
Revenue 35,691 32,949 30,059 28,389 25,249 20,981 811
Provision for credit losses 2,204 2,383 1,717 1,722 1,684 1,727 (8) 5
Noninterest expense 20,742 19,018 17,573 17,190 14,711 13,794 99
Before effect of change in
accounting principle (1)
Net income $ 8,482 $ 7,671 $ 7,014 $ 6,202 $ 5,710 $ 3,411 11 20
Earnings per common share 2.52 2.27 2.07 1.84 1.68 0.99 11 21
Diluted earnings
per common share 2.49 2.25 2.05 1.83 1.66 0.98 11 21
After effect of change in
accounting principle
Net income $ 8,482 $ 7,671 $ 7,014 $ 6,202 $ 5,434 $ 3,411 11 20
Earnings per common share 2.52 2.27 2.07 1.84 1.60 0.99 11 21
Diluted earnings
per common share 2.49 2.25 2.05 1.83 1.58 0.98 11 21
Dividends declared
per common share 1.08 1.00 0.93 0.75 0.55 0.50 817
BALANCE SHEET
(at year end)
Securities available for sale $ 42,629 $ 41,834 $ 33,717 $ 32,953 $ 27,947 $ 40,308 21
Loans 319,116 310,837 287,586 253,073 192,478 167,096 314
Allowance for loan losses 3,764 3,871 3,762 3,891 3,819 3,717 (3) —
Goodwill 11,275 10,787 10,681 10,371 9,753 9,527 53
Assets 481,996 481,741 427,849 387,798 349,197 307,506 —9
Core deposits (2) 270,224 253,341 229,703 211,271 198,234 182,295 78
Long-term debt 87,145 79,668 73,580 63,642 47,320 36,095 919
Guaranteed preferred beneficial
interests in Company’s
subordinated debentures (3) — — — — 2,885 2,435 ——
Stockholders’ equity 45,876 40,660 37,866 34,469 30,319 27,175 13 11
(1) Change in accounting principle is for a transitional goodwill impairment charge recorded in 2002 upon adoption of FAS 142, Goodwill and Other Intangible Assets.
(2) Core deposits are noninterest-bearing deposits, interest-bearing checking, savings certificates, and market rate and other savings.
(3) At December 31, 2003, upon adoption of FIN 46 (revised December 2003), Consolidation of Variable Interest Entities (FIN 46(R)), these balances were reflected in
long-term debt. See Note 12 (Long-Term Debt) to Financial Statements for more information.