Wells Fargo 2006 Annual Report Download - page 109
Download and view the complete annual report
Please find page 109 of the 2006 Wells Fargo annual report below. You can navigate through the pages in the report by either clicking on the pages listed below, or by using the keyword search tool below to find specific information within the annual report.-
 1
1 -
2
-
3
-
4
-
5
-
6
-
7
-
8
-
9
-
10
-
11
-
12
-
13
-
14
-
15
-
16
-
17
-
18
-
19
-
20
-
21
-
22
-
23
-
24
-
25
-
26
-
27
-
28
-
29
-
30
-
31
-
32
-
33
-
34
-
35
-
36
-
37
-
38
-
39
-
40
-
41
-
42
-
43
-
44
-
45
-
46
-
47
-
48
-
49
-
50
-
51
-
52
-
53
-
54
-
55
-
56
-
57
-
58
-
59
-
60
-
61
-
62
-
63
-
64
-
65
-
66
-
67
-
68
-
69
-
70
-
71
-
72
-
73
-
74
-
75
-
76
-
77
-
78
-
79
-
80
-
81
-
82
-
83
-
84
-
85
-
86
-
87
-
88
-
89
-
90
-
91
-
92
-
93
-
94
-
95
-
96
-
97
-
98
-
 99
99 -
 100
100 -
 101
101 -
 102
102 -
 103
103 -
 104
104 -
 105
105 -
 106
106 -
 107
107 -
 108
108 -
 109
109 -
 110
110 -
 111
111 -
 112
112 -
 113
113 -
 114
114 -
 115
115 -
 116
116 -
 117
117 -
 118
118 -
 119
119 -
120
-
121
-
122
-
123
-
124
-
125
-
126
-
127
-
128
 |
 |

107
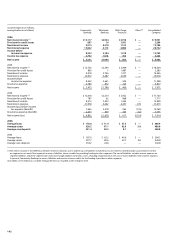
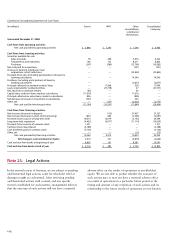
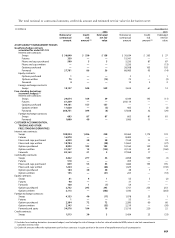
Note 22: Condensed Consolidating Financial Statements
Condensed Consolidating Statement of Income
(in millions) Parent WFFI Other Eliminations Consolidated
consolidating Company
subsidiaries
Year ended December 31, 2006
Dividends from subsidiaries:
Bank $2,176 $ — $ — $(2,176) $ —
Nonbank 876 — — (876) —
Interest income from loans — 5,283 20,370 (42) 25,611
Interest income from subsidiaries 3,266 — — (3,266) —
Other interest income 103 102 6,428 (5)6,628
Total interest income 6,421 5,385 26,798 (6,365) 32,239
Deposits — — 7,174 — 7,174
Short-term borrowings 436 381 1,065 (890) 992
Long-term debt 3,197 1,758 710 (1,543) 4,122
Total interest expense 3,633 2,139 8,949 (2,433) 12,288
NET INTEREST INCOME 2,788 3,246 17,849 (3,932) 19,951
Provision for credit losses —1,061 1,143 —2,204
Net interest income after provision for credit losses 2,788 2,185 16,706 (3,932) 17,747
NONINTEREST INCOME
Fee income –nonaffiliates — 285 8,946 — 9,231
Other 180 259 6,126 (56)6,509
Total noninterest income 180 544 15,072 (56)15,740
NONINTEREST EXPENSE
Salaries and benefits 95 1,128 10,704 — 11,927
Other 22 976 8,753 (936) 8,815
Total noninterest expense 117 2,104 19,457 (936) 20,742
INCOME BEFORE INCOME TAX EXPENSE
(BENEFIT) AND EQUITY IN UNDISTRIBUTED
INCOME OF SUBSIDIARIES 2,851 625 12,321 (3,052) 12,745
Income tax expense (benefit) (165) 205 4,223 — 4,263
Equity in undistributed income of subsidiaries 5,466 — — (5,466) —
NET INCOME $8,482 $ 420 $ 8,098 $(8,518) $ 8,482
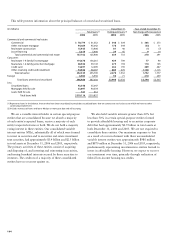
Following are the condensed consolidating financial statements
of the Parent and Wells Fargo Financial, Inc. and its wholly-
owned subsidiaries (WFFI). In 2002, the Parent issued a full
and unconditional guarantee of all outstanding term debt
securities and commercial paper of WFFI. WFFI ceased filing
periodic reports under the Securities Exchange Act of 1934
and is no longer a separately rated company. The Parent also
guaranteed all outstanding term debt securities of Wells Fargo
Financial Canada Corporation (WFFCC), WFFI’s wholly-
owned Canadian subsidiary. WFFCC has continued to issue
term debt securities and commercial paper in Canada, fully
guaranteed by the Parent. The Wells Fargo Financial business
segment for management reporting (see Note 19) consists of
WFFI and other affiliated consumer finance entities managed
by WFFI that are included within other consolidating
subsidiaries in the following tables.