Wells Fargo 2006 Annual Report Download - page 88
Download and view the complete annual report
Please find page 88 of the 2006 Wells Fargo annual report below. You can navigate through the pages in the report by either clicking on the pages listed below, or by using the keyword search tool below to find specific information within the annual report.-
 1
1 -
2
-
3
-
4
-
5
-
6
-
7
-
8
-
9
-
10
-
11
-
12
-
13
-
14
-
15
-
16
-
17
-
18
-
19
-
20
-
21
-
22
-
23
-
24
-
25
-
26
-
27
-
28
-
29
-
30
-
31
-
32
-
33
-
34
-
35
-
36
-
37
-
38
-
39
-
40
-
41
-
42
-
43
-
44
-
45
-
46
-
47
-
48
-
49
-
50
-
51
-
52
-
53
-
54
-
55
-
56
-
57
-
58
-
59
-
60
-
61
-
62
-
63
-
64
-
65
-
66
-
67
-
68
-
69
-
70
-
71
-
72
-
73
-
74
-
75
-
76
-
77
-
 78
78 -
 79
79 -
 80
80 -
 81
81 -
 82
82 -
 83
83 -
 84
84 -
 85
85 -
 86
86 -
 87
87 -
 88
88 -
 89
89 -
 90
90 -
 91
91 -
 92
92 -
 93
93 -
 94
94 -
 95
95 -
 96
96 -
 97
97 -
 98
98 -
99
-
100
-
101
-
102
-
103
-
104
-
105
-
106
-
107
-
108
-
109
-
110
-
111
-
112
-
113
-
114
-
115
-
116
-
117
-
118
-
119
-
120
-
121
-
122
-
123
-
124
-
125
-
126
-
127
-
128
 |
 |

86
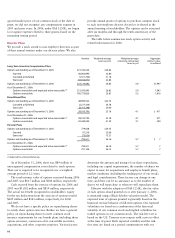
The gross carrying amount of intangible assets and
accumulated amortization was:
Note 8: Intangible Assets
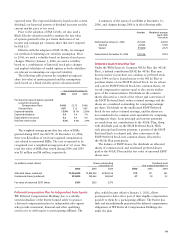
We based our projections of amortization expense shown
above on existing asset balances at December 31, 2006.
Future amortization expense may vary based on additional
core deposit or other intangibles acquired through
business combinations.
(in millions) December 31,
2006 2005
Gross Accumulated Gross Accumulated
carrying amortization carrying amortization
amount amount
Amortized intangible assets:
MSRs, before valuation
allowance (1):
Residential $— $—$24,957 $11,382
Commercial 457 80 169 46
Core deposit
intangibles 2,374 1,991 2,432 1,943
Credit card and
other intangibles 581 378 567 312
Total intangible
assets $ 3,412 $2,449 $28,125 $13,683
MSRs (fair value) (1) $17,591 $—
Trademark 14 14
(1) Prior to 2006, amortized intangible assets included both residential and commercial
MSRs. Effective January 1, 2006, upon adoption of FAS 156, residential MSRs are
measured at fair value and are no longer amortized.See Note 21 for additional
information on MSRs.
(in millions) Core Other(1) Total
deposit
intangibles
Year ended
December 31, 2006 $112 $100 $212
Estimate for year ended
December 31,
2007 $102 $ 93 $195
2008 94 82 176
2009 86 75 161
2010 77 70 147
2011 19 61 80
(1) Includes amortized commercial MSRs and credit card and other intangibles.
The following table provides the current year and
estimated future amortization expense for amortized
intangible assets.
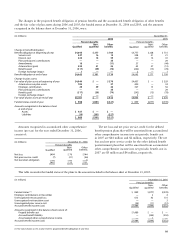
The changes in the carrying amount of goodwill as allocated to our operating segments for goodwill impairment analysis were:
Note 9: Goodwill
For goodwill impairment testing, enterprise-level goodwill
acquired in business combinations is allocated to reporting units
based on the relative fair value of assets acquired and recorded
in the respective reporting units. Through this allocation, we
assigned enterprise-level goodwill to the reporting units that
are expected to benefit from the synergies of the combination.
We used discounted estimated future net cash flows to evaluate
goodwill reported at all reporting units.
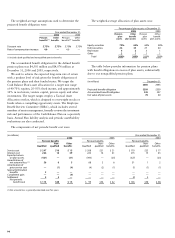
For our goodwill impairment analysis, we allocate all
of the goodwill to the individual operating segments. For
management reporting we do not allocate all of the goodwill
to the individual operating segments; some is allocated at
the enterprise level. See Note 19 for further information
on management reporting. The balances of goodwill for
management reporting were:
(in millions) Community Wholesale Wells Fargo Enterprise Consolidated
Banking Banking Financial Company
December 31, 2005 $ 3,516 $ 1,108 $366 $ 5,797 $ 10,787
December 31, 2006 3,538 1,574 366 5,797 11,275
(in millions) Community Wholesale Wells Fargo Consolidated
Banking Banking Financial Company
December 31, 2004 $ 7,291 $ 3,037 $ 353 $ 10,681
Reduction in goodwill related to divested businesses (31) (3) — (34)
Goodwill from business combinations 125 13 — 138
Realignment of automobile financing business (11) — 11 —
Foreign currency translation adjustments — — 2 2
December 31, 2005 7,374 3,047 366 10,787
Goodwill from business combinations 30 458 — 488
Realignment of businesses (primarily insurance) (19) 19 — —
December 31, 2006 $7,385 $3,524 $366 $11,275