Wells Fargo 2006 Annual Report Download - page 73
Download and view the complete annual report
Please find page 73 of the 2006 Wells Fargo annual report below. You can navigate through the pages in the report by either clicking on the pages listed below, or by using the keyword search tool below to find specific information within the annual report.-
 1
1 -
2
-
3
-
4
-
5
-
6
-
7
-
8
-
9
-
10
-
11
-
12
-
13
-
14
-
15
-
16
-
17
-
18
-
19
-
20
-
21
-
22
-
23
-
24
-
25
-
26
-
27
-
28
-
29
-
30
-
31
-
32
-
33
-
34
-
35
-
36
-
37
-
38
-
39
-
40
-
41
-
42
-
43
-
44
-
45
-
46
-
47
-
48
-
49
-
50
-
51
-
52
-
53
-
54
-
55
-
56
-
57
-
58
-
59
-
60
-
61
-
62
-
 63
63 -
 64
64 -
 65
65 -
 66
66 -
 67
67 -
 68
68 -
 69
69 -
 70
70 -
 71
71 -
 72
72 -
 73
73 -
 74
74 -
 75
75 -
 76
76 -
 77
77 -
 78
78 -
 79
79 -
 80
80 -
 81
81 -
 82
82 -
 83
83 -
84
-
85
-
86
-
87
-
88
-
89
-
90
-
91
-
92
-
93
-
94
-
95
-
96
-
97
-
98
-
99
-
100
-
101
-
102
-
103
-
104
-
105
-
106
-
107
-
108
-
109
-
110
-
111
-
112
-
113
-
114
-
115
-
116
-
117
-
118
-
119
-
120
-
121
-
122
-
123
-
124
-
125
-
126
-
127
-
128
 |
 |

71
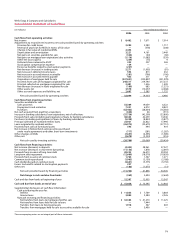
Wells Fargo & Company and Subsidiaries
Consolidated Statement of Cash Flows
(in millions) Year ended December 31,
2006 2005 2004
Cash flows from operating activities:
Net income $ 8,482 $ 7,671 $ 7,014
Adjustments to reconcile net income to net cash provided (used) by operating activities:
Provision for credit losses 2,204 2,383 1,717
Reversal of provision for MSRs in excess of fair value —(378) (208)
Change in fair value of residential MSRs 2,453 ——
Depreciation and amortization 3,221 4,161 3,449
Net gains on securities available for sale (326) (40) (60)
Net gains on mortgage loan origination/sales activities (1,116) (1,085) (539)
Other net losses (gains) (259) (75) 9
Preferred shares released to ESOP 355 307 265
Stock option compensation expense 134 ——
Excess tax benefits related to stock option payments (227) ——
Net decrease (increase) in trading assets 5,271 (1,905) (81)
Net increase in deferred income taxes 593 813 432
Net increase in accrued interest receivable (291) (796) (196)
Net increase in accrued interest payable 455 311 47
Originations of mortgages held for sale (237,841) (230,897) (221,978)
Proceeds from sales of mortgages originated for sale 240,517 214,740 217,272
Principal collected on mortgages originated for sale 2,401 1,426 1,409
Net decrease (increase) in loans originated for sale (109) 683 (1,331)
Other assets, net 3,570 (10,237) (2,468)
Other accrued expenses and liabilities, net 2,607 3,585 1,732
Net cash provided (used) by operating activities 32,094 (9,333) 6,485
Cash flows from investing activities:
Securities available for sale:
Sales proceeds 53,304 19,059 6,322
Prepayments and maturities 7,321 6,972 8,823
Purchases (62,462) (28,634) (16,583)
Net cash acquired from (paid for) acquisitions (626) 66 (331)
Increase in banking subsidiaries’ loan originations, net of collections (37,730) (42,309) (33,800)
Proceeds from sales (including participations) of loans by banking subsidiaries 38,343 42,239 14,540
Purchases (including participations) of loans by banking subsidiaries (5,338) (8,853) (5,877)
Principal collected on nonbank entities’ loans 23,921 22,822 17,996
Loans originated by nonbank entities (26,974) (33,675) (27,751)
Proceeds from sales of foreclosed assets 593 444 419
Net increase in federal funds sold, securities purchased
under resale agreements and other short-term investments (717) (281) (1,287)
Other changes in MSRs (7,657) (4,595) (1,389)
Other, net (2,678) (3,324) (516)
Net cash used by investing activities (20,700) (30,069) (39,434)
Cash flows from financing activities:
Net increase (decrease) in deposits (4,452) 38,961 27,327
Net increase (decrease) in short-term borrowings (11,156) 1,878 (2,697)
Proceeds from issuance of long-term debt 20,255 26,473 29,394
Long-term debt repayment (12,609) (18,576) (19,639)
Proceeds from issuance of common stock 1,764 1,367 1,271
Common stock repurchased (1,965) (3,159) (2,188)
Cash dividends paid on common stock (3,641) (3,375) (3,150)
Excess tax benefits related to stock option payments 227 ——
Other, net (186) (1,673) (13)
Net cash provided (used) by financing activities (11,763) 41,896 30,305
Net change in cash and due from banks (369) 2,494 (2,644)
Cash and due from banks at beginning of year 15,397 12,903 15,547
Cash and due from banks at end of year $ 15,028 $ 15,397 $ 12,903
Supplemental disclosures of cash flow information:
Cash paid during the year for:
Interest $ 11,833 $ 7,769 $ 3,864
Income taxes 3,084 3,584 2,326
Noncash investing and financing activities:
Net transfers from loans to mortgages held for sale $ 32,383 $ 41,270 $ 11,225
Net transfers from loans held for sale to loans —7,444 —
Transfers from loans to foreclosed assets 1,918 567 603
Transfers from mortgages held for sale to securities available for sale —5,490 —
The accompanying notes are an integral part of these statements.