Vodafone 2012 Annual Report Download - page 99
Download and view the complete annual report
Please find page 99 of the 2012 Vodafone annual report below. You can navigate through the pages in the report by either clicking on the pages listed below, or by using the keyword search tool below to find specific information within the annual report.-
 1
1 -
2
-
3
-
4
-
5
-
6
-
7
-
8
-
9
-
10
-
11
-
12
-
13
-
14
-
15
-
16
-
17
-
18
-
19
-
20
-
21
-
22
-
23
-
24
-
25
-
26
-
27
-
28
-
29
-
30
-
31
-
32
-
33
-
34
-
35
-
36
-
37
-
38
-
39
-
40
-
41
-
42
-
43
-
44
-
45
-
46
-
47
-
48
-
49
-
50
-
51
-
52
-
53
-
54
-
55
-
56
-
57
-
58
-
59
-
60
-
61
-
62
-
63
-
64
-
65
-
66
-
67
-
68
-
69
-
70
-
71
-
72
-
73
-
74
-
75
-
76
-
77
-
78
-
79
-
80
-
81
-
82
-
83
-
84
-
85
-
86
-
87
-
88
-
 89
89 -
 90
90 -
 91
91 -
 92
92 -
 93
93 -
 94
94 -
 95
95 -
 96
96 -
 97
97 -
 98
98 -
 99
99 -
 100
100 -
 101
101 -
 102
102 -
 103
103 -
 104
104 -
 105
105 -
 106
106 -
 107
107 -
 108
108 -
 109
109 -
110
-
111
-
112
-
113
-
114
-
115
-
116
-
117
-
118
-
119
-
120
-
121
-
122
-
123
-
124
-
125
-
126
-
127
-
128
-
129
-
130
-
131
-
132
-
133
-
134
-
135
-
136
-
137
-
138
-
139
-
140
-
141
-
142
-
143
-
144
-
145
-
146
-
147
-
148
-
149
-
150
-
151
-
152
-
153
-
154
-
155
-
156
-
157
-
158
-
159
-
160
-
161
-
162
-
163
-
164
-
165
-
166
-
167
-
168
-
169
-
170
-
171
-
172
-
173
-
174
-
175
-
176
 |
 |

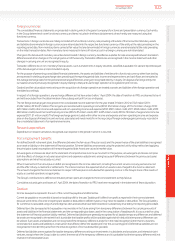
Business review Performance Governance Financials Additional information
97
Vodafone Group Plc
Annual Report 2012
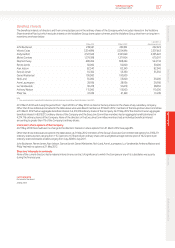
Consolidated statement of cash ows
for the years ended 31 March
2012 2011 2010
Note £m £m £m
Net cash ow from operating activities 27 12,755 11,995 13,064
Cash ows from investing activities
Purchase of interests in subsidiaries and joint ventures, net of cash acquired (149) (46) (1,777)
Other investing activities in relation to purchase of subsidiaries 310 (356) –
Purchase of interests in associates (5) – –
Purchase of intangible assets (3,090) (4,290) (2,134)
Purchase of property, plant and equipment (4,762) (4,350) (4,841)
Purchase of investments (417) (318) (522)
Disposal of interests in subsidiaries and joint ventures, net of cash disposed 832 – –
Disposal of interests in associates 6,799 – –
Disposal of property, plant and equipment 117 51 48
Disposal of investments 66 4,467 17
Dividends received from associates 4,023 1,424 1,436
Dividends received from investments 3 85 141
Interest received 322 1,659 195
Taxation on investing activities (206) (208) –
Net cash ow from investing activities 3,843 (1,882) (7,437)
Cash ows from nancing activities
Issue of ordinary share capital and reissue of treasury shares 71 107 70
Net movement in short-term borrowings 1,206 (573) 227
Proceeds from issue of long-term borrowings 1,642 4,861 4,217
Repayment of borrowings (3,520) (4,064) (5,184)
Purchase of treasury shares (3,583) (2,087) –
Equity dividends paid (6,643) (4,468) (4,139)
Dividends paid to non-controlling shareholders in subsidiaries (304) (320) (56)
Contributions from non-controlling shareholders in subsidiaries – – 613
Other transactions with non-controlling shareholders in subsidiaries (2,605) (137) –
Interest paid (1,633) (1,578) (1,601)
Net cash ow from nancing activities (15,369) (8,259) (5,853)
Net cash ow 1,229 1,854 (226)
Cash and cash equivalents at beginning of the nancial year 18 6,205 4,363 4,846
Exchange loss on cash and cash equivalents (346) (12) (257)
Cash and cash equivalents at end of the nancial year 18 7,088 6,205 4,363
The accompanying notes are an integral part of these consolidated nancial statements.