Vodafone 2012 Annual Report Download - page 130
Download and view the complete annual report
Please find page 130 of the 2012 Vodafone annual report below. You can navigate through the pages in the report by either clicking on the pages listed below, or by using the keyword search tool below to find specific information within the annual report.-
 1
1 -
2
-
3
-
4
-
5
-
6
-
7
-
8
-
9
-
10
-
11
-
12
-
13
-
14
-
15
-
16
-
17
-
18
-
19
-
20
-
21
-
22
-
23
-
24
-
25
-
26
-
27
-
28
-
29
-
30
-
31
-
32
-
33
-
34
-
35
-
36
-
37
-
38
-
39
-
40
-
41
-
42
-
43
-
44
-
45
-
46
-
47
-
48
-
49
-
50
-
51
-
52
-
53
-
54
-
55
-
56
-
57
-
58
-
59
-
60
-
61
-
62
-
63
-
64
-
65
-
66
-
67
-
68
-
69
-
70
-
71
-
72
-
73
-
74
-
75
-
76
-
77
-
78
-
79
-
80
-
81
-
82
-
83
-
84
-
85
-
86
-
87
-
88
-
89
-
90
-
91
-
92
-
93
-
94
-
95
-
96
-
97
-
98
-
99
-
100
-
101
-
102
-
103
-
104
-
105
-
106
-
107
-
108
-
109
-
110
-
111
-
112
-
113
-
114
-
115
-
116
-
117
-
118
-
119
-
 120
120 -
 121
121 -
 122
122 -
 123
123 -
 124
124 -
 125
125 -
 126
126 -
 127
127 -
 128
128 -
 129
129 -
 130
130 -
 131
131 -
 132
132 -
 133
133 -
 134
134 -
 135
135 -
 136
136 -
 137
137 -
 138
138 -
 139
139 -
 140
140 -
141
-
142
-
143
-
144
-
145
-
146
-
147
-
148
-
149
-
150
-
151
-
152
-
153
-
154
-
155
-
156
-
157
-
158
-
159
-
160
-
161
-
162
-
163
-
164
-
165
-
166
-
167
-
168
-
169
-
170
-
171
-
172
-
173
-
174
-
175
-
176
 |
 |

128
Vodafone Group Plc
Annual Report 2012
Notes to the consolidated nancial statements (continued)
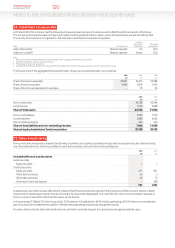
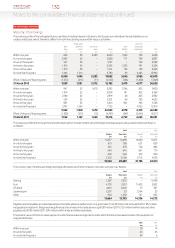
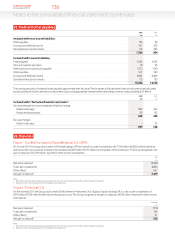
22. Borrowings
Carrying value and fair value information
2012 2011
Short-term Long-term Short-term Long-term
borrowings borrowings Total borrowings borrowings Total
£m £m £m £m £m £m
Financial liabilities measured at amortised cost:
Bank loans 1,635 5,624 7,259 2,070 5,872 7,942
Bank overdrafts 50 – 50 47 – 47
Redeemable preference shares – 1,281 1,281 – 1,169 1,169
Commercial paper 2,272 – 2,272 1,660 – 1,660
Bonds 1,289 14,463 15,752 2,470 16,046 18,516
Other liabilities1 2 1,012 2,417 3,429 3,659 1,023 4,682
Bonds in fair value hedge relationships – 4,577 4,577 – 4,265 4,265
6,258 28,362 34,620 9,906 28,375 38,281
Notes:
1 At 31 March 2012 amount includes £980million (2011: £531million) in relation to collateral support agreements.
2 Amounts at 31 March 2012 includes £840million (2011: £3,190million) in relation to the options disclosed in note 12.
Bank loans include INR 273 billion of loans held by Vodafone India Limited (‘VIL’) and its subsidiaries (the ‘VIL Group’). The VIL Group has a number
ofsecurity arrangements supporting certain licences secured under the terms of tri-party agreements between the relevant borrower, the
department of telecommunications, Government of India and the agent representing the secured lenders and certain share pledges of the shares
under VIL. Theterms and conditions of the security arrangements mean that should members of the VIL Group not meet all of their loan payment
and performance obligations, the lenders may sell the pledged shares and enforce rights over the certain licences under the terms of the tri-party
agreements to recover their losses, with any remaining sales proceeds being returned to the VIL Group. Each of the eight legal entities within the VIL
Group provide cross guarantees to the lenders in respect to debt contracted by the other seven.
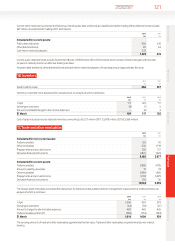
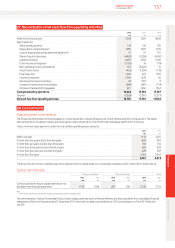
The fair value and carrying value of the Group’s short-term borrowings is as follows:
Sterling equivalent
nominal value Fair value Carrying value
2012 2011 2012 2011 2012 2011
£m £m £m £m £m £m
Financial liabilities measured at amortised cost 4,915 7,316 4,977 7,425 4,969 7,436
Bonds: 1,267 2,444 1,288 2,463 1,289 2,470
1.15% US dollar 100million bond due August 2012 63 – 63 – 63 –
3.625% euro 1,250million bond
due November2012 1,032 – 1,051 – 1,050 –
6.75% Australian dollar 265million bond
due January 2013 172 – 174 – 176 –
US dollar oating rate note due June 2011 – 171 – 171 – 171
5.5% US dollar 750million bond due June 2011 – 467 – 471 – 478
1% US dollar 100million bond due August 2011 – 45 – 45 – 45
Euro oating rate note due January 2012 – 1,144 – 1,146 – 1,148
US dollar oating rate note due February 2012 – 306 – 306 – 306
5.35% US dollar 500million bond due February 2012 – 311 – 324 – 322
Short-term borrowings 6,182 9,760 6,265 9,888 6,258 9,906