Vodafone 2012 Annual Report Download - page 48
Download and view the complete annual report
Please find page 48 of the 2012 Vodafone annual report below. You can navigate through the pages in the report by either clicking on the pages listed below, or by using the keyword search tool below to find specific information within the annual report.-
 1
1 -
2
-
3
-
4
-
5
-
6
-
7
-
8
-
9
-
10
-
11
-
12
-
13
-
14
-
15
-
16
-
17
-
18
-
19
-
20
-
21
-
22
-
23
-
24
-
25
-
26
-
27
-
28
-
29
-
30
-
31
-
32
-
33
-
34
-
35
-
36
-
37
-
 38
38 -
 39
39 -
 40
40 -
 41
41 -
 42
42 -
 43
43 -
 44
44 -
 45
45 -
 46
46 -
 47
47 -
 48
48 -
 49
49 -
 50
50 -
 51
51 -
 52
52 -
 53
53 -
 54
54 -
 55
55 -
 56
56 -
 57
57 -
 58
58 -
59
-
60
-
61
-
62
-
63
-
64
-
65
-
66
-
67
-
68
-
69
-
70
-
71
-
72
-
73
-
74
-
75
-
76
-
77
-
78
-
79
-
80
-
81
-
82
-
83
-
84
-
85
-
86
-
87
-
88
-
89
-
90
-
91
-
92
-
93
-
94
-
95
-
96
-
97
-
98
-
99
-
100
-
101
-
102
-
103
-
104
-
105
-
106
-
107
-
108
-
109
-
110
-
111
-
112
-
113
-
114
-
115
-
116
-
117
-
118
-
119
-
120
-
121
-
122
-
123
-
124
-
125
-
126
-
127
-
128
-
129
-
130
-
131
-
132
-
133
-
134
-
135
-
136
-
137
-
138
-
139
-
140
-
141
-
142
-
143
-
144
-
145
-
146
-
147
-
148
-
149
-
150
-
151
-
152
-
153
-
154
-
155
-
156
-
157
-
158
-
159
-
160
-
161
-
162
-
163
-
164
-
165
-
166
-
167
-
168
-
169
-
170
-
171
-
172
-
173
-
174
-
175
-
176
 |
 |

46
Vodafone Group Plc
Annual Report 2012
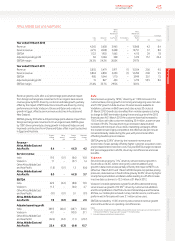
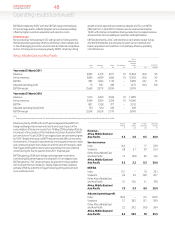
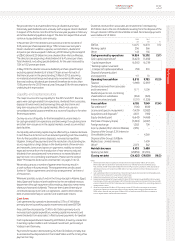
Net investment income/(nancing costs)
2011
£m
2010
£m
Investment income 1,309 716
Financing costs (429) (1,512)
Net investment income/(nancing costs) 880 (796)
Analysed as:
Net nancing costs before income
from investments (852) (1,024)
Potential interest charges arising on settlement
of outstanding tax issues1(46) (23)
Income from investments 83 145
Foreign exchange2 256 (1)
Equity put rights and similar arrangements395 (94)
Interest related to the settlement of tax cases4872 201
Disposal of SoftBank Mobile Corp. Limited
nancial instruments 472 –
880 (796)
Notes:
1 Excluding interest credits related to a tax case settlement.
2 Comprises foreign exchange rate differences reected in the income statement in relation to certain
intercompany balances and the foreign exchange rate differences on nancial instruments received as
consideration on the disposal of Vodafone Japan to SoftBank in April 2006.
3 Includes foreign exchange rate movements, accretion expense and fair value charges.
4 The £872 million in the year ended 31 March 2011 relates to the settlement of a tax case and the
£201million in the year ended 31 March 2010 relates to the settlement of the German tax loss claim.
Net nancing costs before income from investments decreased from
£1,024 million to £852 million primarily due to a reduction in net
debt,partially offset by an increase in average interest rates for debt
denominated in US dollars. In addition, £138 million of interest was
capitalised compared to £1 million in the prior year. At 31 March 2011
the provision for potential interest charges arising on settlement of
outstanding tax issues was £398 million (31 March 2010: £1,312 million),
with the reduction primarily reecting the settlement of a tax case.
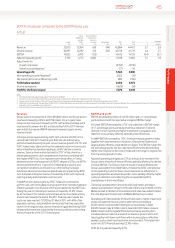
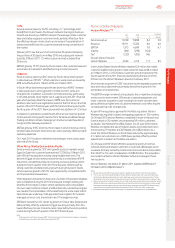
Taxation
2011
£m
2010
£m
Income tax expense 1,628 56
Tax on adjustments to derive
adjusted prot before tax (232) (39)
Tax benet related to
settlement of tax cases1 929 2,103
Adjusted income tax expense 2,325 2,120
Share of associates’ tax 519 572
Adjusted income tax expense for purposes
of calculating adjusted taxrate 2,844 2,692
Prot before tax 9,498 8,674
Adjustments to derive adjusted
prot before tax2 1,505 1,890
Adjusted prot before tax 11,003 10,564
Add: Share of associates’ tax and non-controlling
interest 604 652
Adjusted prot before tax for the purpose of
calculating adjusted effective tax rate 11,607 11,216
Adjusted effective tax rate 24.5% 24.0%
Notes:
1 The £929 million in the year ended 31 March 2011 relates to the settlement of a tax case and the
£2,103million in the year ended 31 March 2010 relates to the settlement of the German tax loss claim.
2 See “Earnings per share”.
The adjusted effective tax rate for the year ended 31 March 2011 was
24.5%. This is in line with the adjusted effective tax rate for the year
ended 31 March 2010 of 24.0%. Tax on adjustments to derive adjusted
prot before tax includes tax payable on the gain on the disposal of the
Group’s 3.2% interest in China Mobile Limited.
Income tax expense includes a credit of £929 million arising as a result of
the settlement of a tax case in July 2010.
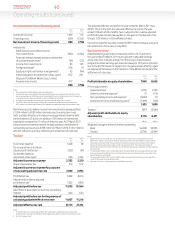
Earnings per share
Adjusted earnings per share increased by 4.0% to 16.75 pence for
theyear ended 31 March 2011 due to growth in adjusted earnings
andareduction in shares arising from the Group’s share buyback
programme. Basic earnings per share decreased to 15.2 pence primarily
due to the £6,150 million of impairment charges partially offset by a gain
on disposal of the Group’s 3.2% interest in China Mobile Limited and the
settlement of a tax case.
2011
£m
2010
£m
Prot attributable to equity shareholders 7,968 8,645
Pre-tax adjustments:
Impairment loss16,150 2,100
Other income and expense272 (114)
Non-operating income and expense3(3,022) 10
Investment income and nancing costs4(1,695) (106)
1,505 1,890
Taxation1(697) (2,064)
Adjusted prot attributable to equity
shareholders 8,776 8,471
Million Million
Weighted average number of shares outstanding
Basic 52,408 52,595
Diluted 52,748 52,849
Notes:
1 Taxation for the 2011 nancial year included £929 million credit in respect of a tax settlement and a
£208million charge in respect of the disposal of the Group’s interest in China Mobile Limited. The 2010
nancial year included £2,103 million arising from the German tax authorities’ decision that €15 billion
oflosses booked by a German subsidiary in 2001 were tax deductible. The impairment charges of
£6,150million and £2,100 million in the 2011 and 2010 nancial years respectively did not result in any tax
consequences.
2 The year ended 31 March 2011 includes £56 million representing the net loss on disposal of certain Alltel
investments by Verizon Wireless. This is included within the line item ‘Share of results in associates’ in the
consolidated income statement.
3 The year ended 31 March 2011 includes £3,019 million representing the prot arising on the sale of the
Group’s 3.2% interest in China Mobile Limited.
4 See notes 2, 3, and 4 in “Net investment income/(nancing costs)”.
Operating results (continued)