Vodafone 2012 Annual Report Download - page 111
Download and view the complete annual report
Please find page 111 of the 2012 Vodafone annual report below. You can navigate through the pages in the report by either clicking on the pages listed below, or by using the keyword search tool below to find specific information within the annual report.-
 1
1 -
2
-
3
-
4
-
5
-
6
-
7
-
8
-
9
-
10
-
11
-
12
-
13
-
14
-
15
-
16
-
17
-
18
-
19
-
20
-
21
-
22
-
23
-
24
-
25
-
26
-
27
-
28
-
29
-
30
-
31
-
32
-
33
-
34
-
35
-
36
-
37
-
38
-
39
-
40
-
41
-
42
-
43
-
44
-
45
-
46
-
47
-
48
-
49
-
50
-
51
-
52
-
53
-
54
-
55
-
56
-
57
-
58
-
59
-
60
-
61
-
62
-
63
-
64
-
65
-
66
-
67
-
68
-
69
-
70
-
71
-
72
-
73
-
74
-
75
-
76
-
77
-
78
-
79
-
80
-
81
-
82
-
83
-
84
-
85
-
86
-
87
-
88
-
89
-
90
-
91
-
92
-
93
-
94
-
95
-
96
-
97
-
98
-
99
-
100
-
 101
101 -
 102
102 -
 103
103 -
 104
104 -
 105
105 -
 106
106 -
 107
107 -
 108
108 -
 109
109 -
 110
110 -
 111
111 -
 112
112 -
 113
113 -
 114
114 -
 115
115 -
 116
116 -
 117
117 -
 118
118 -
 119
119 -
 120
120 -
 121
121 -
122
-
123
-
124
-
125
-
126
-
127
-
128
-
129
-
130
-
131
-
132
-
133
-
134
-
135
-
136
-
137
-
138
-
139
-
140
-
141
-
142
-
143
-
144
-
145
-
146
-
147
-
148
-
149
-
150
-
151
-
152
-
153
-
154
-
155
-
156
-
157
-
158
-
159
-
160
-
161
-
162
-
163
-
164
-
165
-
166
-
167
-
168
-
169
-
170
-
171
-
172
-
173
-
174
-
175
-
176
 |
 |

Business review Performance Governance Financials Additional information
109
Vodafone Group Plc
Annual Report 2012
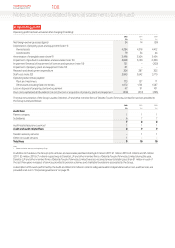
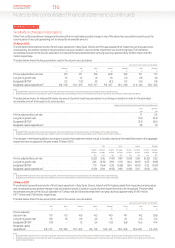
5. Investment income and nancing costs
2012 2011 2010
£m £m £m
Investment income:
Available-for-sale investments:
Dividends received 2 83 145
Loans and receivables at amortised cost 168 339 423
Gain on settlement of loans and receivables1– 472 –
Fair value through the income statement (held for trading):
Derivatives – foreign exchange contracts 121 38 3
Other2165 263 92
Equity put rights and similar arrangements3– 114 53
456 1,309 716
Financing costs:
Items in hedge relationships:
Other loans 211 746 888
Interest rate swaps (178) (338) (464)
Dividends on redeemable preference shares 56 58 56
Fair value hedging instrument (539) (47) 228
Fair value of hedged item 511 40 (183)
Cash ow hedges transferred from equity – 17 82
Other nancial liabilities held at amortised cost:
Bank loans and overdrafts4769 629 591
Other loans2785 121 185
Potential interest credit on settlement of tax issues5(9) (826) (178)
Equity put rights and similar arrangements2 3 81 19 94
Finance leases 1 9 7
Fair value through the income statement (held for trading):
Derivatives – forward starting swaps and futures 244 1 206
1,932 429 1,512
Net nancing costs/(investment income) 1,476 (880) 796
Notes:
1 Gain on settlement of loans and receivables issued by SoftBank Mobile Corp.
2 Amounts for 2012 include net foreign exchange gains of £55 million (2011: £405 million gain; 2010 £78 million loss) arising from net investments in foreign operations, investments held following the disposal of Vodafone
Japan to SoftBank Corp. and net foreign exchange movements on certain intercompany balances.
3 Includes amounts in relation to the Group’s arrangements with its minority partners in India.
4 The Group capitalised £25 million of interest expense in the year (2011: £138 million; 2010: £1 million). The interest rate used to determine the amount of borrowing costs eligible for capitalisation was 5.0%.
5 Amounts for 2012, 2011 and 2010 include a reduction of the provision for potential interest on tax issues.
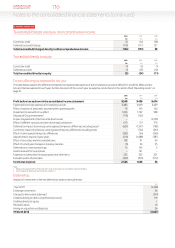
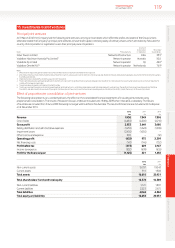
6. Taxation
Income tax expense
2012 2011 2010
£m £m £m
United Kingdom corporation tax (income)/expense:
Current year – 141 40
Adjustments in respect of prior years (4) (5) (4)
(4) 136 36
Overseas current tax expense/(income):
Current year 2,440 2,152 2,377
Adjustments in respect of prior years (231) (477) (1,718)
2,209 1,675 659
Total current tax expense 2,205 1,811 695
Deferred tax on origination and reversal of temporary differences:
United Kingdom deferred tax (8) (275) (166)
Overseas deferred tax 349 92 (473)
Total deferred tax expense/(income) 341 (183) (639)
Total income tax expense 2,546 1,628 56