Vodafone 2012 Annual Report Download - page 115
Download and view the complete annual report
Please find page 115 of the 2012 Vodafone annual report below. You can navigate through the pages in the report by either clicking on the pages listed below, or by using the keyword search tool below to find specific information within the annual report.-
 1
1 -
2
-
3
-
4
-
5
-
6
-
7
-
8
-
9
-
10
-
11
-
12
-
13
-
14
-
15
-
16
-
17
-
18
-
19
-
20
-
21
-
22
-
23
-
24
-
25
-
26
-
27
-
28
-
29
-
30
-
31
-
32
-
33
-
34
-
35
-
36
-
37
-
38
-
39
-
40
-
41
-
42
-
43
-
44
-
45
-
46
-
47
-
48
-
49
-
50
-
51
-
52
-
53
-
54
-
55
-
56
-
57
-
58
-
59
-
60
-
61
-
62
-
63
-
64
-
65
-
66
-
67
-
68
-
69
-
70
-
71
-
72
-
73
-
74
-
75
-
76
-
77
-
78
-
79
-
80
-
81
-
82
-
83
-
84
-
85
-
86
-
87
-
88
-
89
-
90
-
91
-
92
-
93
-
94
-
95
-
96
-
97
-
98
-
99
-
100
-
101
-
102
-
103
-
104
-
 105
105 -
 106
106 -
 107
107 -
 108
108 -
 109
109 -
 110
110 -
 111
111 -
 112
112 -
 113
113 -
 114
114 -
 115
115 -
 116
116 -
 117
117 -
 118
118 -
 119
119 -
 120
120 -
 121
121 -
 122
122 -
 123
123 -
 124
124 -
 125
125 -
126
-
127
-
128
-
129
-
130
-
131
-
132
-
133
-
134
-
135
-
136
-
137
-
138
-
139
-
140
-
141
-
142
-
143
-
144
-
145
-
146
-
147
-
148
-
149
-
150
-
151
-
152
-
153
-
154
-
155
-
156
-
157
-
158
-
159
-
160
-
161
-
162
-
163
-
164
-
165
-
166
-
167
-
168
-
169
-
170
-
171
-
172
-
173
-
174
-
175
-
176
 |
 |

Business review Performance Governance Financials Additional information
113
Vodafone Group Plc
Annual Report 2012
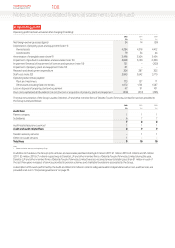
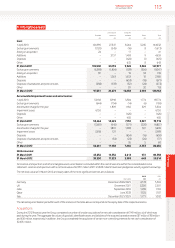
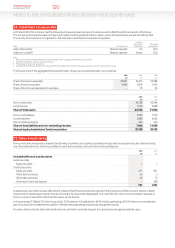
9. Intangible assets
Licences and Computer
Goodwill spectrum software Other Total
£m £m £m £m £m
Cost:
1 April 2010 104,996 27,547 8,244 3,245 144,032
Exchange movements (1,120) (545) (16) 8 (1,673)
Arising on acquisition 24 – 17 – 41
Additions – 3,157 1,493 9 4,659
Disposals – – (424) (1) (425)
Other – – 635 8 643
31 March 2011 103,900 30,159 9,949 3,269 147,277
Exchange movements (6,398) (1,804) (539) (306) (9,047)
Arising on acquisition 87 – 19 33 139
Additions – 1,263 1,653 10 2,926
Disposals – – (653) (18) (671)
Disposals of subsidiaries and joint ventures (358) (139) (52) (24) (573)
Other – – 81 32 113
31 March 2012 97,231 29,479 10,458 2,996 140,164
Accumulated impairment losses and amortisation:
1 April 2010 53,158 8,918 5,924 1,774 69,774
Exchange movements (644) (104) (14) (6) (768)
Amortisation charge for the year – 1,809 1,166 529 3,504
Impairment losses 6,150 – – – 6,150
Disposals – – (426) – (426)
Other – – 485 – 485
31 March 2011 58,664 10,623 7,135 2,297 78,719
Exchange movements (3,601) (645) (371) (220) (4,837)
Amortisation charge for the year – 1,891 1,298 307 3,496
Impairment losses 3,818 121 – – 3,939
Disposals – – (634) (16) (650)
Disposals of subsidiaries and joint ventures – (34) (23) (20) (77)
Other – – 55 5 60
31 March 2012 58,881 11,956 7,460 2,353 80,650
Net book value:
31 March 2011 45,236 19,536 2,814 972 68,558
31 March 2012 38,350 17,523 2,998 643 59,514
For licences and spectrum and other intangible assets, amortisation is included within the cost of sales line within the consolidated income
statement. Licences and spectrum with a net book value of £2,991million (2011: £3,845million) have been pledged as security against borrowings.
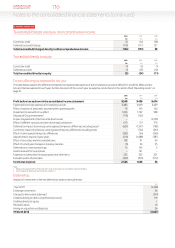
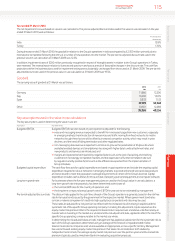
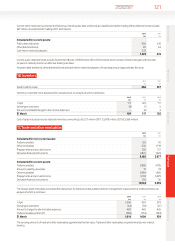
The net book value at 31 March 2012 and expiry dates of the most signicant licences are as follows:
2012 2011
Expiry date £m £m
Germany December 2020/2025 4,778 5,540
UK December 2021 3,250 3,581
India September 2030 1,455 1,746
Qatar June 2028 1,125 1,187
Italy December 2021/2029 1,771 1,002
The remaining amortisation period for each of the licences in the table above corresponds to the expiry date of the respective licence.
Acquisitions
During the 2012 nancial year the Group completed a number of smaller acquisitions for net cash consideration of £149 million, all of which was
paidduring the year. The aggregate fair values of goodwill, identiable assets and liabilities of the acquired operations were £87 million, £98 million
and £36 million, respectively. In addition, the Group completed the acquisition of certain non-controlling interests for net cash consideration of
£2,605million.