Vodafone 2012 Annual Report Download - page 114
Download and view the complete annual report
Please find page 114 of the 2012 Vodafone annual report below. You can navigate through the pages in the report by either clicking on the pages listed below, or by using the keyword search tool below to find specific information within the annual report.-
 1
1 -
2
-
3
-
4
-
5
-
6
-
7
-
8
-
9
-
10
-
11
-
12
-
13
-
14
-
15
-
16
-
17
-
18
-
19
-
20
-
21
-
22
-
23
-
24
-
25
-
26
-
27
-
28
-
29
-
30
-
31
-
32
-
33
-
34
-
35
-
36
-
37
-
38
-
39
-
40
-
41
-
42
-
43
-
44
-
45
-
46
-
47
-
48
-
49
-
50
-
51
-
52
-
53
-
54
-
55
-
56
-
57
-
58
-
59
-
60
-
61
-
62
-
63
-
64
-
65
-
66
-
67
-
68
-
69
-
70
-
71
-
72
-
73
-
74
-
75
-
76
-
77
-
78
-
79
-
80
-
81
-
82
-
83
-
84
-
85
-
86
-
87
-
88
-
89
-
90
-
91
-
92
-
93
-
94
-
95
-
96
-
97
-
98
-
99
-
100
-
101
-
102
-
103
-
 104
104 -
 105
105 -
 106
106 -
 107
107 -
 108
108 -
 109
109 -
 110
110 -
 111
111 -
 112
112 -
 113
113 -
 114
114 -
 115
115 -
 116
116 -
 117
117 -
 118
118 -
 119
119 -
 120
120 -
 121
121 -
 122
122 -
 123
123 -
 124
124 -
125
-
126
-
127
-
128
-
129
-
130
-
131
-
132
-
133
-
134
-
135
-
136
-
137
-
138
-
139
-
140
-
141
-
142
-
143
-
144
-
145
-
146
-
147
-
148
-
149
-
150
-
151
-
152
-
153
-
154
-
155
-
156
-
157
-
158
-
159
-
160
-
161
-
162
-
163
-
164
-
165
-
166
-
167
-
168
-
169
-
170
-
171
-
172
-
173
-
174
-
175
-
176
 |
 |

112
Vodafone Group Plc
Annual Report 2012
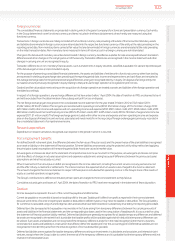
Notes to the consolidated nancial statements (continued)
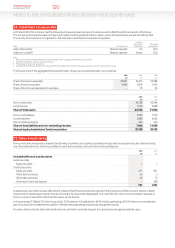
A total deferred tax asset of £1,164million (2011: £1,143 million) has been recognised in relation to some of the losses of a scal unity in Luxembourg
as we expect the members of this scal unity to generate taxable prots against which these losses will be used.£791 million (2011: £856million) of
the asset has been recognised as a result of the agreement reached with the UK tax authorities in respect of the CFC tax case in the prior year.
The Group holds provisions in respect of deferred taxation that would arise if temporary differences on investments in subsidiaries, associates and
interests in joint ventures were to be realised after the year end reporting date. No deferred tax liability has been recognised in respect of a further
£40,515million (2011: £41,607million) of unremitted earnings of subsidiaries, joint ventures and associates because the Group is in a position to
control the timing of the reversal of the temporary difference and it is probable that such differences will not reverse in the foreseeable future. It is
not practicable to estimate the amount of unrecognised deferred tax liabilities in respect of these unremitted earnings.
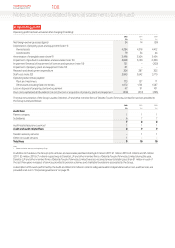
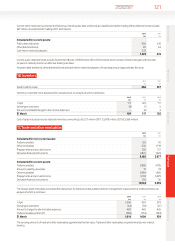
7. Equity dividends
2012 2011 2010
£m £m £m
Declared during the nancial year:
Final dividend for the year ended 31 March 2011: 6.05 pence per share
(2010: 5.65 pence per share, 2009: 5.20 pence per share) 3,102 2,976 2,731
Interim dividend for the year ended 31 March 2012: 3.05 pence per share
(2011: 2.85 pence per share, 2010: 2.66 pence per share) 1,536 1,492 1,400
Second interim dividend share for the year ended 31 March 2012: 4.00 pence per share
(2011: nil, 2010: nil) 2,016 – –
6,654 4,468 4,131
Proposed after the end of reporting period and not recognised as a liability:
Final dividend for the year ended 31 March 2012: 6.47 pence per share
(2011: 6.05 pence per share, 2010: 5.65 pence per share) 3,195 3,106 2,976
8. Earnings per share
2012 2011 2010
Millions Millions Millions
Weighted average number of shares for basic earnings per share 50,644 52,408 52,595
Effect of dilutive potential shares: restricted shares and share options 314 340 254
Weighted average number of shares for diluted earnings per share 50,958 52,748 52,849
£m £m £m
Earnings for basic and diluted earnings per share 6,957 7,968 8,645
6. Taxation (continued)