Vodafone 2012 Annual Report Download - page 110
Download and view the complete annual report
Please find page 110 of the 2012 Vodafone annual report below. You can navigate through the pages in the report by either clicking on the pages listed below, or by using the keyword search tool below to find specific information within the annual report.
108
Vodafone Group Plc
Annual Report 2012
Notes to the consolidated nancial statements (continued)
4. Operating prot
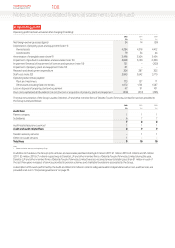
Operating prot has been arrived at after charging/(crediting):
2012 2011 2010
£m £m £m
Net foreign exchange losses/(gains) 34 14 (29)
Depreciation of property, plant and equipment (note 11):
Owned assets 4,284 4,318 4,412
Leased assets 79 54 44
Amortisation of intangible assets (note 9) 3,496 3,504 3,454
Impairment of goodwill in subsidiaries and associates (note 10) 3,848 6,150 2,300
Impairment/(reversal of impairment) of licences and spectrum (note 10) 121 – (200)
Impairment of property, plant and equipment (note 10) 81 – –
Research and development expenditure 304 287 303
Staff costs (note 32) 3,843 3,642 3,770
Operating lease rentals payable:
Plant and machinery 173 127 71
Other assets including xed line rentals 1,672 1,761 1,587
Loss on disposal of property, plant and equipment 47 91 101
Own costs capitalised attributable to the construction or acquisition of property, plant and equipment (374) (331) (296)
The total remuneration of the Group’s auditor, Deloitte LLP and other member rms of Deloitte Touche Tohmatsu Limited for services provided to
the Group is analysed below:
2012 2011 2010
£m £m £m
Audit fees:
Parent company 1 1 1
Subsidiaries 6 7 7
788
Audit-related assurance services1111
Audit and audit-related fees 8 9 9
Taxation advisory services – 1 1
Other non-audit services 1 – –
Total fees 9 10 10
Note:
1 Relates to fees for statutory and regulatory lings.
In addition to the above, the Group’s joint ventures and associates paid fees totalling £2million (2011: £1million, 2010: £2million) and £5million
(2011: £5million, 2010: £7million) respectively to Deloitte LLP and other member rms of Deloitte Touche Tohmatsu Limited during the year.
Deloitte LLP and other member rms of Deloitte Touche Tohmatsu Limited have also received amounts totalling less than £1million in each of
thelast three years in respect of services provided to pension schemes and charitable foundations associated to the Group.
A description of the work performed by the Audit and Risk Committee in order to safeguard auditor independence when non-audit services are
provided is set out in “Corporate governance” on page 70.


