Vodafone 2012 Annual Report Download - page 123
Download and view the complete annual report
Please find page 123 of the 2012 Vodafone annual report below. You can navigate through the pages in the report by either clicking on the pages listed below, or by using the keyword search tool below to find specific information within the annual report.-
 1
1 -
2
-
3
-
4
-
5
-
6
-
7
-
8
-
9
-
10
-
11
-
12
-
13
-
14
-
15
-
16
-
17
-
18
-
19
-
20
-
21
-
22
-
23
-
24
-
25
-
26
-
27
-
28
-
29
-
30
-
31
-
32
-
33
-
34
-
35
-
36
-
37
-
38
-
39
-
40
-
41
-
42
-
43
-
44
-
45
-
46
-
47
-
48
-
49
-
50
-
51
-
52
-
53
-
54
-
55
-
56
-
57
-
58
-
59
-
60
-
61
-
62
-
63
-
64
-
65
-
66
-
67
-
68
-
69
-
70
-
71
-
72
-
73
-
74
-
75
-
76
-
77
-
78
-
79
-
80
-
81
-
82
-
83
-
84
-
85
-
86
-
87
-
88
-
89
-
90
-
91
-
92
-
93
-
94
-
95
-
96
-
97
-
98
-
99
-
100
-
101
-
102
-
103
-
104
-
105
-
106
-
107
-
108
-
109
-
110
-
111
-
112
-
 113
113 -
 114
114 -
 115
115 -
 116
116 -
 117
117 -
 118
118 -
 119
119 -
 120
120 -
 121
121 -
 122
122 -
 123
123 -
 124
124 -
 125
125 -
 126
126 -
 127
127 -
 128
128 -
 129
129 -
 130
130 -
 131
131 -
 132
132 -
 133
133 -
134
-
135
-
136
-
137
-
138
-
139
-
140
-
141
-
142
-
143
-
144
-
145
-
146
-
147
-
148
-
149
-
150
-
151
-
152
-
153
-
154
-
155
-
156
-
157
-
158
-
159
-
160
-
161
-
162
-
163
-
164
-
165
-
166
-
167
-
168
-
169
-
170
-
171
-
172
-
173
-
174
-
175
-
176
 |
 |
Business review Performance Governance Financials Additional information
121
Vodafone Group Plc
Annual Report 2012
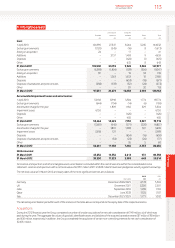
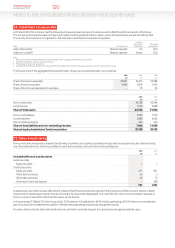
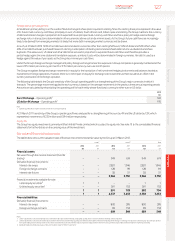
Current other investments comprise the following, of which public debt and bonds are classied as held for trading. Other debt and bonds includes
£87 million of assets held for trading (2011: £64 million):
2012 2011
£m £m
Included within current assets:
Public debt and bonds 900 610
Other debt and bonds 90 64
Cash held in restricted deposits 333 –
1,323 674
Current public debt and bonds include Government Bonds of £900million (2011: £610million) which consist of index linked gilts with less than
sixyears to maturity held on an effective oating rate basis.
For public debt and bonds, other debt and bonds and cash held in restricted deposits, the carrying amount approximates fair value.
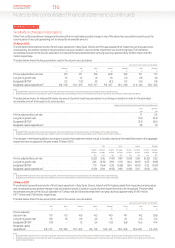
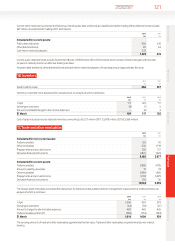
16. Inventory
2012 2011
£m £m
Goods held for resale 486 537
Inventory is reported net of allowances for obsolescence, an analysis of which is as follows:
2012 2011 2010
£m £m £m
1 April 117 120 111
Exchange movements (8) (1) 5
Amounts (credited)/charged to the income statement – (2) 4
31 March 109 117 120
Cost of sales includes amounts related to inventory amounting to £6,327million (2011: £5,878million; 2010: £5,268million).
17. Trade and other receivables
2012 2011
£m £m
Included within non-current assets:
Trade receivables 120 92
Other receivables 235 1,719
Prepayments and accrued income 326 137
Derivative nancial instruments 2,801 1,929
3,482 3,877
Included within current assets:
Trade receivables 3,885 4,185
Amounts owed by associates 15 53
Other receivables 2,984 1,606
Prepayments and accrued income 3,702 3,299
Derivative nancial instruments 158 116
10,744 9,259
The Group’s trade receivables are stated after allowances for bad and doubtful debts based on management’s assessment of creditworthiness, an
analysis of which is asfollows:
2012 2011 2010
£m £m £m
1 April 1,006 929 874
Exchange movements (64) (30) (27)
Amounts charged to administrative expenses 458 460 465
Trade receivables written off (386) (353) (383)
31 March 1,014 1,006 929
The carrying amounts of trade and other receivables approximate their fair value. Trade and other receivables are predominantly non-interest
bearing.