Vodafone 2012 Annual Report Download - page 57
Download and view the complete annual report
Please find page 57 of the 2012 Vodafone annual report below. You can navigate through the pages in the report by either clicking on the pages listed below, or by using the keyword search tool below to find specific information within the annual report.-
 1
1 -
2
-
3
-
4
-
5
-
6
-
7
-
8
-
9
-
10
-
11
-
12
-
13
-
14
-
15
-
16
-
17
-
18
-
19
-
20
-
21
-
22
-
23
-
24
-
25
-
26
-
27
-
28
-
29
-
30
-
31
-
32
-
33
-
34
-
35
-
36
-
37
-
38
-
39
-
40
-
41
-
42
-
43
-
44
-
45
-
46
-
 47
47 -
 48
48 -
 49
49 -
 50
50 -
 51
51 -
 52
52 -
 53
53 -
 54
54 -
 55
55 -
 56
56 -
 57
57 -
 58
58 -
 59
59 -
 60
60 -
 61
61 -
 62
62 -
 63
63 -
 64
64 -
 65
65 -
 66
66 -
 67
67 -
68
-
69
-
70
-
71
-
72
-
73
-
74
-
75
-
76
-
77
-
78
-
79
-
80
-
81
-
82
-
83
-
84
-
85
-
86
-
87
-
88
-
89
-
90
-
91
-
92
-
93
-
94
-
95
-
96
-
97
-
98
-
99
-
100
-
101
-
102
-
103
-
104
-
105
-
106
-
107
-
108
-
109
-
110
-
111
-
112
-
113
-
114
-
115
-
116
-
117
-
118
-
119
-
120
-
121
-
122
-
123
-
124
-
125
-
126
-
127
-
128
-
129
-
130
-
131
-
132
-
133
-
134
-
135
-
136
-
137
-
138
-
139
-
140
-
141
-
142
-
143
-
144
-
145
-
146
-
147
-
148
-
149
-
150
-
151
-
152
-
153
-
154
-
155
-
156
-
157
-
158
-
159
-
160
-
161
-
162
-
163
-
164
-
165
-
166
-
167
-
168
-
169
-
170
-
171
-
172
-
173
-
174
-
175
-
176
 |
 |

Business review Performance Governance Financials Additional information
55
Vodafone Group Plc
Annual Report 2012
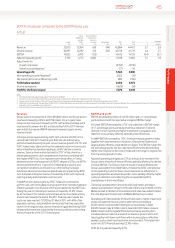
We provide returns to shareholders through dividends and have
historically paid dividends semi-annually, with a regular interim dividend
in respect of the rst six months of the nancial year payable in February
and a nal dividend payable in August. The directors expect that we will
continue to pay dividends semi-annually.
In November 2011 the directors announced an interim dividend of
3.05pence per share representing a 7.0% increase over last year’s
interim dividend. In addition a special, second interim, dividend of
4.0pence per share was paid in February 2012 following the receipt of
aUS$4.5 billion (£2.9 billion) income dividend from Verizon Wireless.
Thedirectors are proposing a nal dividend of 6.47pence per share.
Total dividends, excluding special dividends, for the year increased by
7.0% to 9.52pence per share.
In May 2010 the directors issued a dividend per share growth target,
excluding special dividends, of at least 7% per annum for each of
thenancial years in the period ending 31 March 2013, assuming
nomaterial adverse foreign exchange rate movements. We expect
thattotal ordinary dividends per share will therefore be no less than
10.18pence for the 2013 nancial year. See page 50 for the assumptions
underlying thisexpectation.
Liquidity and capital resources
The major sources of Group liquidity for the 2012 and 2011 nancial
years were cash generated from operations, dividends from associates,
disposal of investments and borrowings through short-term and
long-term issuances in the capital markets. We do not use non-
consolidated special purpose entities as a source of liquidity or for other
nancing purposes.
Our key sources of liquidity for the foreseeable future are likely to
becash generated from operations and borrowings through long-term
and short-term issuances in the capital markets as well as committed
bank facilities.
Our liquidity and working capital may be affected by a material decrease
in cash ow due to factors such as reduced operating cash ow resulting
from further possible business disposals, increased competition,
litigation, timing of tax payments and the resolution of outstanding tax
issues, regulatory rulings, delays in the development of new services
and networks, licence and spectrum payments, inability to receive
expected revenue from the introduction of new services, reduced
dividends from associates and investments or increased dividend
payments to non-controlling shareholders. Please see the section
titled“Principal risk factors and uncertainties” on pages 51 to 53.
We are also party to a number of agreements that may result in
acashoutow in future periods. These agreements are discussed
furtherin “Option agreements and similar arrangements” at the end
ofthis section.
Wherever possible, surplus funds in the Group (except in Albania, Egypt,
India, Qatar and Vodacom) are transferred to the centralised treasury
department through repayment of borrowings, deposits, investments,
share purchases and dividends. These are then loaned internally or
contributed as equity to fund our operations, used to retire external
debt, invested externally or used to fund shareholder returns.
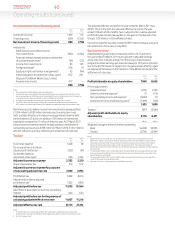
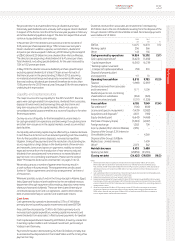
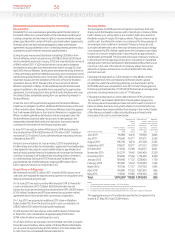
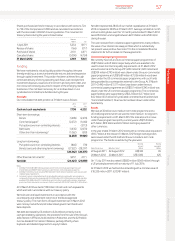
Cash ows
Cash generated by operations decreased by 3.7% to £14.8 billion
primarily driven by working capital movements and lower EBITDA.
Free cash ow decreased by 13.4% to £6.1 billion primarily due to
increased cash capital expenditure, working capital movements and
lower dividends from associates1, offset by lower payments for taxation.
Cash capital expenditure increased by £0.8 billion, driven by a reduction
in working capital creditors and increased investment, particularly in
Vodacom and Germany.
Payments for taxation decreased by 24.2% to £2.0 billion primarily due
to accelerated tax depreciation in the United States and the timing of tax
payments in Italy.
Dividends received from associates and investments1 decreased by
£0.3billion due to the loss of dividends resulting from the disposal of the
Group’s interest in SFR and China Mobile Limited. Net interest payments
were stable at £1.3 billion.
2012 2011
£m £m %
EBITDA 14,475 14,670 (1.3)
Working capital 206 566
Other 143 156
Cash generated by operations 14,824 15,392 (3.7)
Cash capital expenditure2(6,423) (5,658)
Capital expenditure (6,365) (6,219)
Working capital movement
in respect of capital expenditure (58) 561
Disposal of property, plant
and equipment 117 51
Operating free cash ow 8,518 9,785 (12.9)
Taxation (1,969) (2,597)
Dividends received from associates
and investments11,171 1,509
Dividends paid to non-controlling
shareholders in subsidiaries (304) (320)
Interest received and paid (1,311) (1,328)
Free cash ow 6,105 7,049 (13.4)
Tax settlement3(100) (800)
Licence and spectrum payments (1,429) (2,982)
Acquisitions and disposals44,872 (183)
Equity dividends paid (6,643) (4,468)
Purchase of treasury shares (3,583) (2,087)
Foreign exchange 1,283 709
Income dividend from Verizon Wireless 2,855 –
Disposal of the Group’s 3.2% interest in
China Mobile Limited – 4,269
Disposal of the Group’s SoftBank
Mobile Corp. Limited interests – 1,409
Other52,073 542
Net debt decrease 5,433 3,458
Opening net debt (29,858) (33,316)
Closing net debt (24,425) (29,858) (18.2)
Notes:
1 Dividends received from associates and investments for the year ended 31 March 2012 includes
£965million (2011: £1,024 million) tax distribution from our 45% interest in Verizon Wireless and a
naldividend of £178 million (2011: £383 million) from SFR prior to the completion of the disposal of our
44% interest. It does not include the £2,855 million income dividend from Verizon Wireless received in
January 2012.
2 Cash capital expenditure comprises the purchase of property, plant and equipment and intangible assets,
other than licence and spectrum payments, during the year.
3 Related to a tax settlement in the year ended 31 March 2011.
4 Acquisitions and disposals for the year ended 31 March 2012 primarily includes £6,805 million proceeds
from the sale of the Group’s 44% interest in SFR, £784 million proceeds from the sale of the Group’s 24.4%
interest in Polkomtel and £2,592 million payment in relation to the purchase of non-controlling interests in
Vodafone India Limited.
5 Other for the year ended 31 March 2012 primarily includes £2,301 million movement in the written
putoptions in relation to India and the return of a court deposit made in respect of the India tax case
(£310million). Other for the year ended 31 March 2011 primarily includes £356 million in relation to
acourtdeposit made in respect of the India tax case.