Vodafone 2012 Annual Report Download - page 119
Download and view the complete annual report
Please find page 119 of the 2012 Vodafone annual report below. You can navigate through the pages in the report by either clicking on the pages listed below, or by using the keyword search tool below to find specific information within the annual report.-
 1
1 -
2
-
3
-
4
-
5
-
6
-
7
-
8
-
9
-
10
-
11
-
12
-
13
-
14
-
15
-
16
-
17
-
18
-
19
-
20
-
21
-
22
-
23
-
24
-
25
-
26
-
27
-
28
-
29
-
30
-
31
-
32
-
33
-
34
-
35
-
36
-
37
-
38
-
39
-
40
-
41
-
42
-
43
-
44
-
45
-
46
-
47
-
48
-
49
-
50
-
51
-
52
-
53
-
54
-
55
-
56
-
57
-
58
-
59
-
60
-
61
-
62
-
63
-
64
-
65
-
66
-
67
-
68
-
69
-
70
-
71
-
72
-
73
-
74
-
75
-
76
-
77
-
78
-
79
-
80
-
81
-
82
-
83
-
84
-
85
-
86
-
87
-
88
-
89
-
90
-
91
-
92
-
93
-
94
-
95
-
96
-
97
-
98
-
99
-
100
-
101
-
102
-
103
-
104
-
105
-
106
-
107
-
108
-
 109
109 -
 110
110 -
 111
111 -
 112
112 -
 113
113 -
 114
114 -
 115
115 -
 116
116 -
 117
117 -
 118
118 -
 119
119 -
 120
120 -
 121
121 -
 122
122 -
 123
123 -
 124
124 -
 125
125 -
 126
126 -
 127
127 -
 128
128 -
 129
129 -
130
-
131
-
132
-
133
-
134
-
135
-
136
-
137
-
138
-
139
-
140
-
141
-
142
-
143
-
144
-
145
-
146
-
147
-
148
-
149
-
150
-
151
-
152
-
153
-
154
-
155
-
156
-
157
-
158
-
159
-
160
-
161
-
162
-
163
-
164
-
165
-
166
-
167
-
168
-
169
-
170
-
171
-
172
-
173
-
174
-
175
-
176
 |
 |

Business review Performance Governance Financials Additional information
117
Vodafone Group Plc
Annual Report 2012
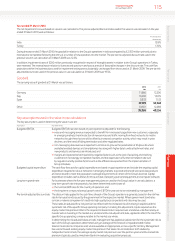
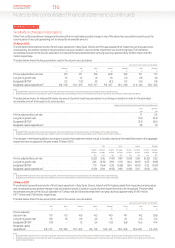
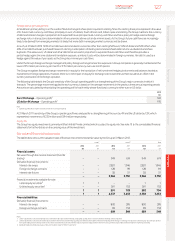
The table below shows, for Turkey, India and Ghana, the amount by which each key assumption must change in isolation in order for the estimated
recoverable amount to be equal to its carrying value.
Change required for the carrying value
to equal the recoverable amount1
Turkey India Ghana
pps pps pps
Pre-tax adjusted discount rate 5.6 1.1 6.9
Long-term growth rate (19.6) (1.0) n/a
Budgeted EBITDA2(4.7) (2.2) (8.7)
Budgeted capital expenditure37.0 2.5 8.9
Notes:
1 The recoverable amount for Greece, which was impaired at 30 September 2010, equals the carrying value at 31 March 2011.
2 Budgeted EBITDA is expressed as the compound annual growth rates in the initial ten years for Turkey and Ghana and the initial ve years for all other cash generating units of the plans used for impairment testing.
3 Budgeted capital expenditure is expressed as a percentage of revenue in the initial ten years for Turkey and Ghana and the initial ve years for all other cash generating units of the plans used for impairment testing.
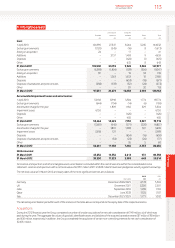
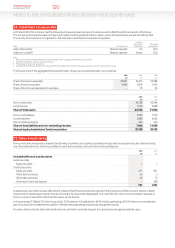
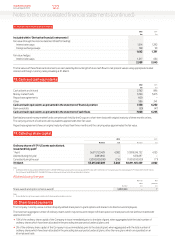
11. Property, plant and equipment
Equipment,
Land and xtures
buildings and ttings Total
£m £m £m
Cost:
1 April 2010 1,577 46,845 48,422
Exchange movements (16) (678) (694)
Additions 122 4,604 4,726
Disposals (21) (3,001) (3,022)
Reclassications 69 (732) (663)
31 March 2011 1,731 47,038 48,769
Exchange movements (89) (2,933) (3,022)
Arising on acquisition 2 5 7
Additions 140 4,562 4,702
Disposals (29) (1,458) (1,487)
Disposals of subsidiaries and joint ventures – (604) (604)
Other (53) (45) (98)
31 March 2012 1,702 46,565 48,267
Accumulated depreciation and impairment:
1 April 2010 633 27,147 27,780
Exchange movements (4) (114) (118)
Charge for the year 99 4,273 4,372
Disposals (19) (2,942) (2,961)
Other – (485) (485)
31 March 2011 709 27,879 28,588
Exchange movements (33) (1,652) (1,685)
Charge for the year 98 4,265 4,363
Impairment losses – 81 81
Disposals (23) (1,252) (1,275)
Disposals of subsidiaries and joint ventures – (400) (400)
Other – (60) (60)
31 March 2012 751 28,861 29,612
Net book value:
31 March 2011 1,022 19,159 20,181
31 March 2012 951 17,704 18,655
The net book value of land and buildings and equipment, xtures and ttings includes £58 million and £233 million respectively (2011: £131 million
and £155 million) in relation to assets held under nance leases. Included in the net book value of land and buildings and equipment, xtures
andttings are assets in the course of construction, which are not depreciated, with a cost of £28 million and £2,037 million respectively (2011:
£38million and £2,375 million). Property, plant and equipment with a net book value of £893 million (2011: £972 million) has been pledged as
security against borrowings.